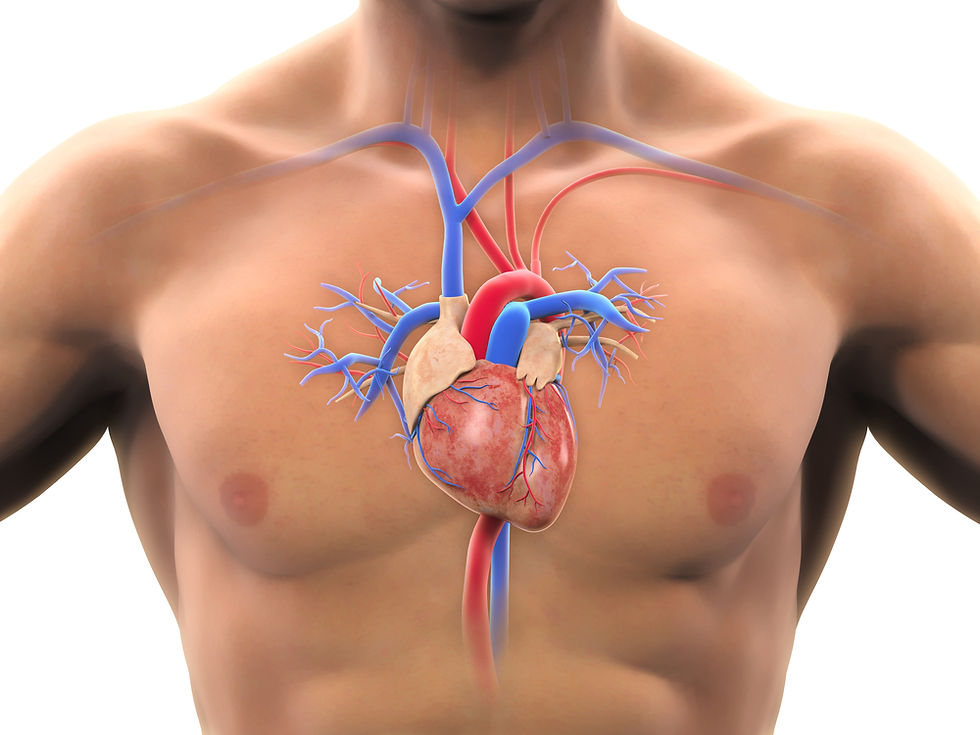
HRV indexes how efficiently we mobilize and utilize limited self-regulatory resources to maintain homeostasis. HRV plays a vital role in regulatory capacity, executive functions, health, and performance. This review addresses 18 misconceptions regarding cardiovascular health, HRV measurement, and HRV biofeedback training. We highlight the importance of context and individual differences in interpreting HRV. We debunk common misconceptions to improve HRV biofeedback training for health and performance.

Heart Rate Variability
Heart rate variability (HRV) has emerged as a significant biomarker for assessing cardiovascular health and autonomic nervous system function. Despite its growing application in clinical and research settings, misconceptions about HRV persist. This document aims to dispel these myths by providing evidence-based insights into HRV, clarifying its physiological underpinnings, measurement, and implications for biofeedback training. By demystifying these aspects, we endeavor to enhance the understanding and effective utilization of HRV in clinical practice, ultimately contributing to improved patient care and outcomes.
Cardiovascular Health
We will cover two cardiovascular health myths:
1. Variability is bad, stability is good.
2. A healthy heart is a metronome.
Myth 1. Variability is bad, stability is good.
Not all variability is healthy. Whereas heart rate variability (HRV) is desirable, blood pressure (BP) variability can endanger health. Blood pressure variability contributes to organ damage and cardiovascular risk in hypertensive patients, and drugs can potentially smooth antihypertensive action by reducing excessive variability (Parati et al., 2013). We require BP stability under constant workloads (Gevirtz, 2020). Figure 1 shows blood pressure stability.

Figure 1 illustrates BP variability adapted by minaanandag at Fiverr.com.
Figure 2 explains the "Variability is bad, stability is good" myth.
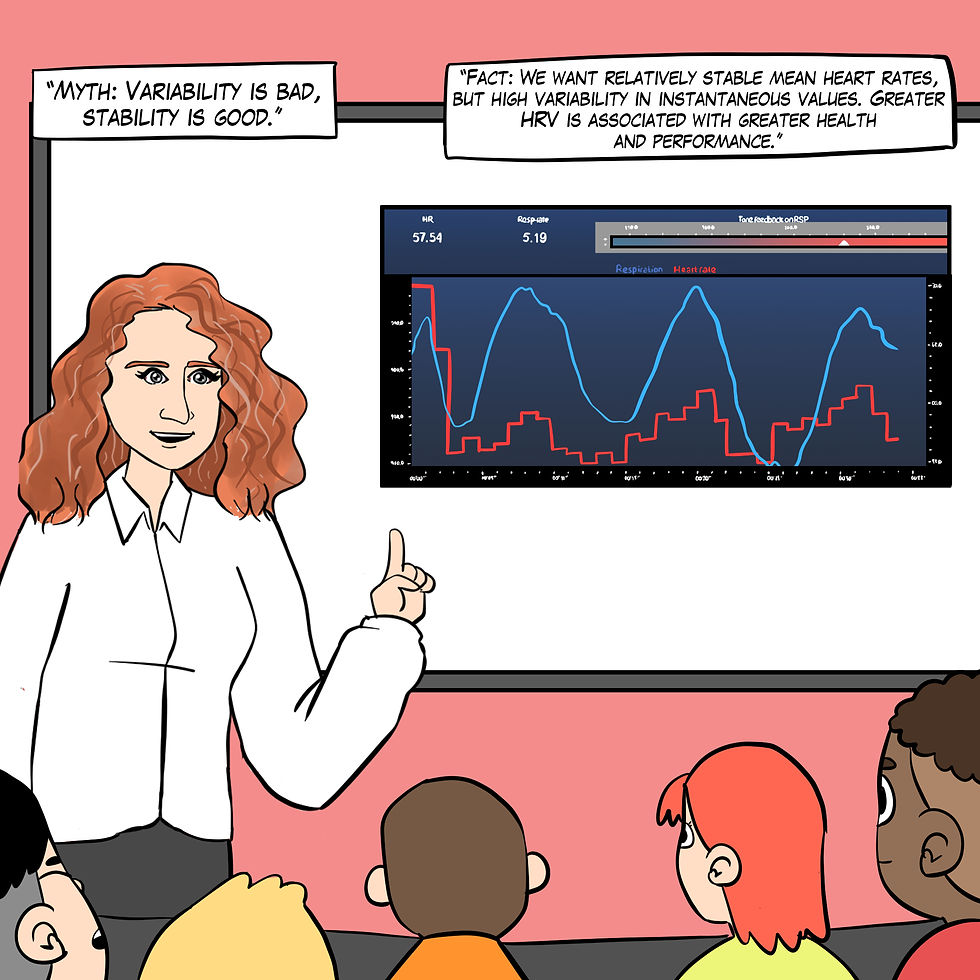
Figure 2. The "Variability is bad, stability is good" myth. Real Genius episode by Dani S at Fiverr.com.
Higher HRV is beneficial for cardiovascular health, autonomic function, emotional regulation, physical performance, self-control, and potentially longer survival in chronic illnesses (Camillo et al., 2011; Conder et al., 2014; Dan et al., 2022; Giese-Davis, 2015; Grässler et al., 2021; Maier & Hare, 2017; Routledge et al., 2010; Schuit et al., 1999).
Clinical takeaway: Stabilize blood pressure variability through behavioral and lifestyle interventions and medication while increasing heart rate variability for greater health and performance.
Myth 2. A healthy heart resembles a metronome.
"A healthy heart is not a metronome" (Shaffer et al., 2014).
The cardiovascular center can effectively modulate vagal tone when the time intervals between heartbeats significantly change across successive breathing cycles.
"The complexity of a healthy heart rhythm is critical to the maintenance of homeostasis because it provides the flexibility to cope with an uncertain and changing environment...HRV metrics are important because they are associated with regulatory capacity, health, and performance and can predict morbidity and mortality" (Shaffer et al., 2020).
Figure 3 shows healthy heart rate variability. The time intervals between successive beats differ.

Figure 3. Healthy heart rate variability. Graphic by minaanandag at Fiverr.com.
In contrast, Figure 4 shows low heart rate variability since the interbeat intervals (IBIs) are identical. This could represent a heart that may soon need a pacemaker.

Figure 4. Low heart rate variability. Graphic by minaanandag at Fiverr.com.
"The complexity of a healthy heart rhythm is critical to the maintenance of homeostasis because it provides the flexibility to cope with an uncertain and changing environment” (Shaffer et al., 2020).
Figure 5 addresses the "Healthy heart resembles a metronome" myth.
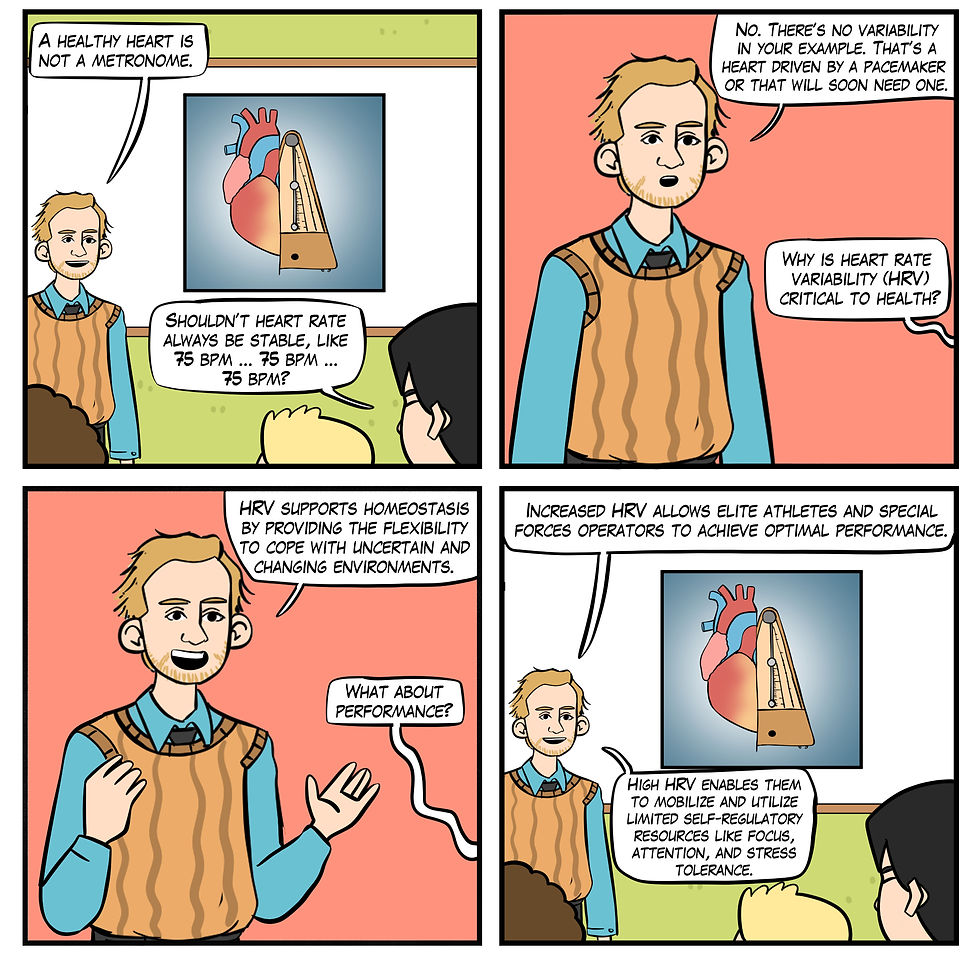
Figure 5. A healthy heart is not a metronome. Real Genius episode by Dani S at Fiverr.com.
Clinical takeaway: Increase HRV by lowering HR by hydrating, getting sufficient sleep, reducing cannabis, caffeine and nicotine, and managing life stress. Also, increase HRV through aerobic exercise, slow-paced breathing (SPB), and slow-paced contraction (SPC).
HRV Sources
We will cover the HRV source myth that short-term resting HRV contains a sympathetic component.
Myth 3. Short-term (~5 min) resting HRV is partially sympathetic.
Research using tilt tables to provoke a sympathetic nervous system (SNS) response has fueled the myth that resting HRV contains a sympathetic component. A tilt table (Figure 6) typically consists of a flat surface on which the patient lies, secured with straps to prevent falling. The table can be gradually tilted from a horizontal to a vertical position, allowing the patient to experience controlled weight-bearing. Tilt tables are commonly used in clinical and research settings to study the body's cardiovascular and autonomic responses to changes in posture. A key area of interest is how tilt tables influence sympathetic nervous system activation, which plays a crucial role in maintaining blood pressure and heart rate (HR) during orthostatic stress (Kamiya et al., 2009).

Figure 6. Tilt table graphic © Pepermpron/Shutterstock.com.
However, respiratory sinus arrhythmia (RSA), the baroreceptor reflex, and the vascular tone rhythm are the most important sources of short-term (~5-min) HRV. They are exclusively produced by the parasympathetic nervous system (PNS; Hayano & Yuda, 2019; Vaschillo et al., 2002). Figures 7 and 8 show the three main parasympathetic HRV sources.
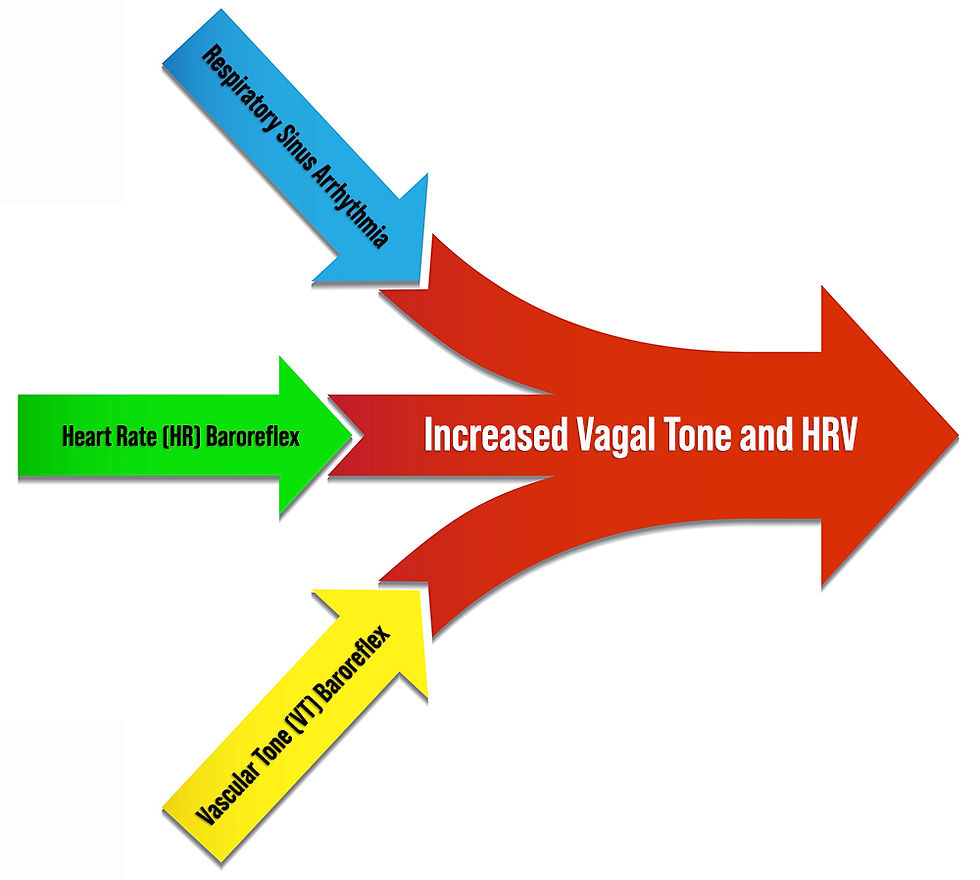
Figure 7. Three main parasympathetic HRV sources. Graphic created by authors.
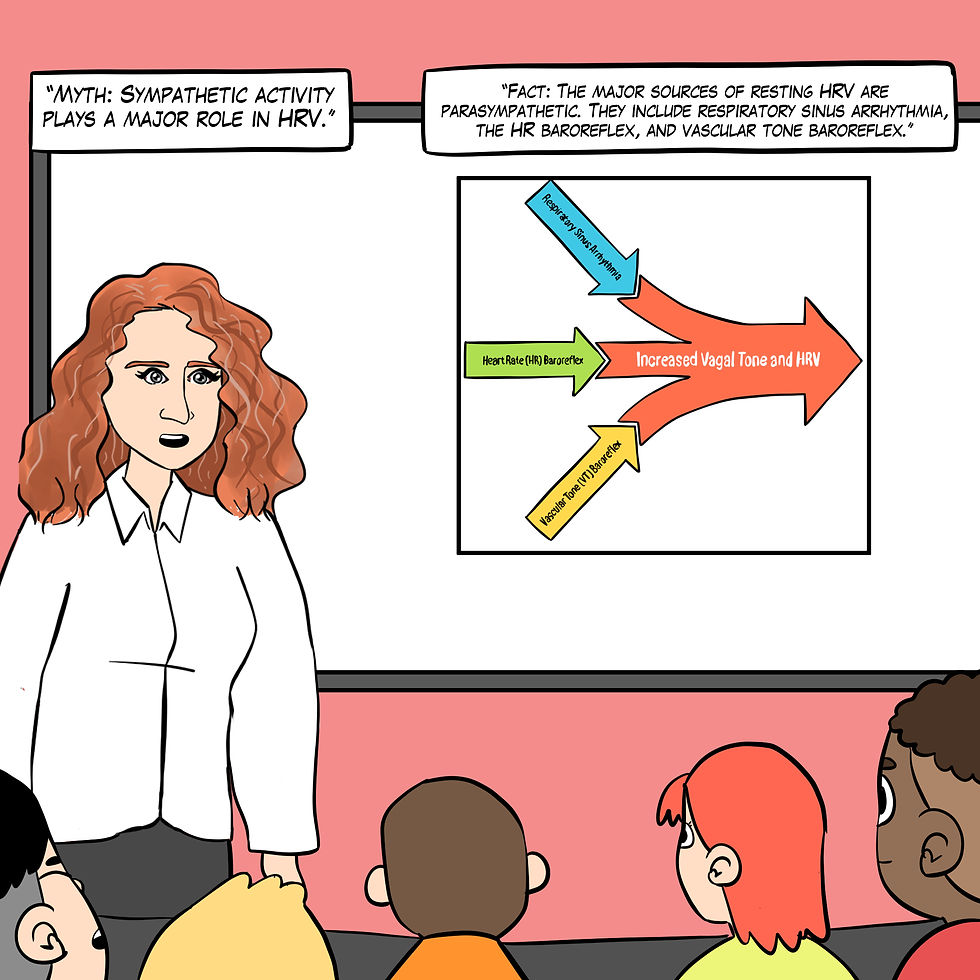
Figure 8. The "Sympathetic activity plays a major role in HRV" myth. Real Genius episode by Dani S at Fiverr.com.
RSA, HR speeding and slowing across each breathing cycle, is the primary and entirely PNS source of HRV (Gevirtz, 2020). Figure 8 illustrates RSA.

Figure 9. BioGraph Infiniti screenshot of RSA by authors. The blue waveform is respiration and the red is instantaneous heart rate.
We adapted Figure 10 with permission from Elite Academy. The upper waveform represents the breathing cycle, and the lower signals are heartbeats.
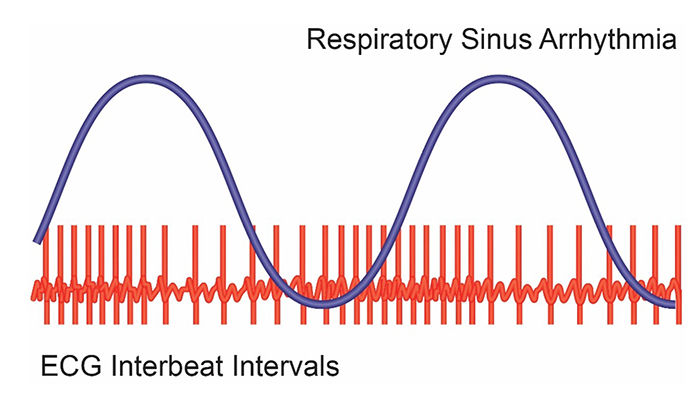
Figure 10. The heartbeats are closer together during inhalation and further apart during exhalation. Illustration by minaanandag at Fiver.com.
In Figure 11, inhalation partially disengages the vagal brake, speeding HR. This is purely parasympathetic. Graphics inspired by Dr. Richard Gevirtz.

Figure 11. HR speeds during inhalation. Graphic by Dani S at Fiverr.com.
In Figure 12, exhalation reapplies the vagal brake, slowing HR. Figures 10 and 11 illustrate the disengaging and re-engaging of the vagal brake across each breathing cycle that contributes to respiratory sinus arrhythmia.

Figure 12. HR slows during exhalation. Graphic by Dani S. at Fiverr.com.
Vaschillo’s two closed-loop model (2002) described the HR and vascular tone (VT) baroreflexes as closed loops. They proposed that stimulating one closed loop activates its counterpart. We adapted Figure 12 from Vaschillo and colleagues.
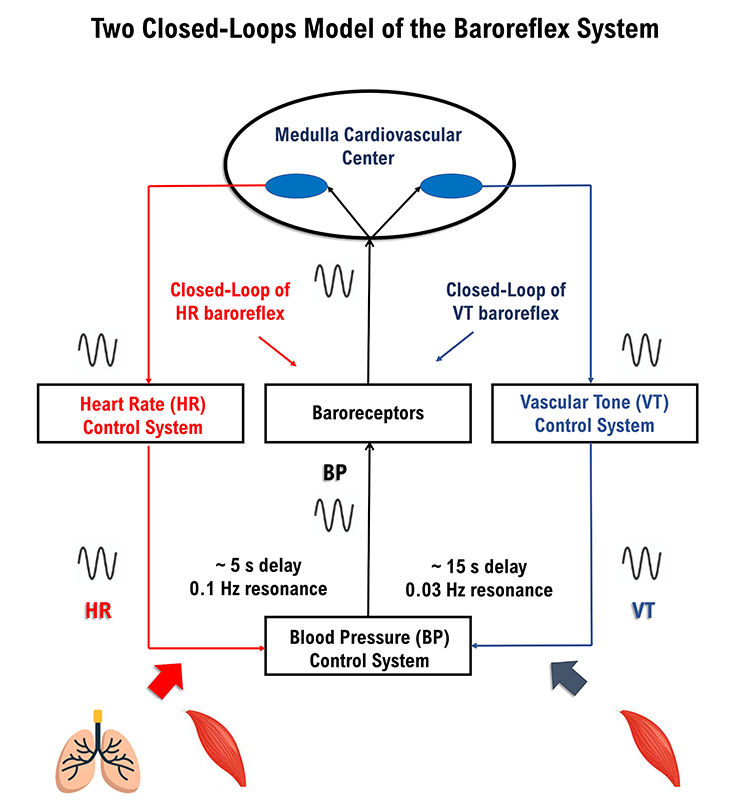
Figure 13. Two closed-loop model drawn by authors.
Each baroreflex is a potential target for HRV biofeedback training. The HR baroreflex regulates acute BP changes to ensure stability. Although HRV promotes health, BP variability
endangers it.
The vascular tone (VT) baroreflex regulates resistance blood vessel diameter. A larger arteriole diameter means lower blood pressure. Figure 14 illustrates arterioles.
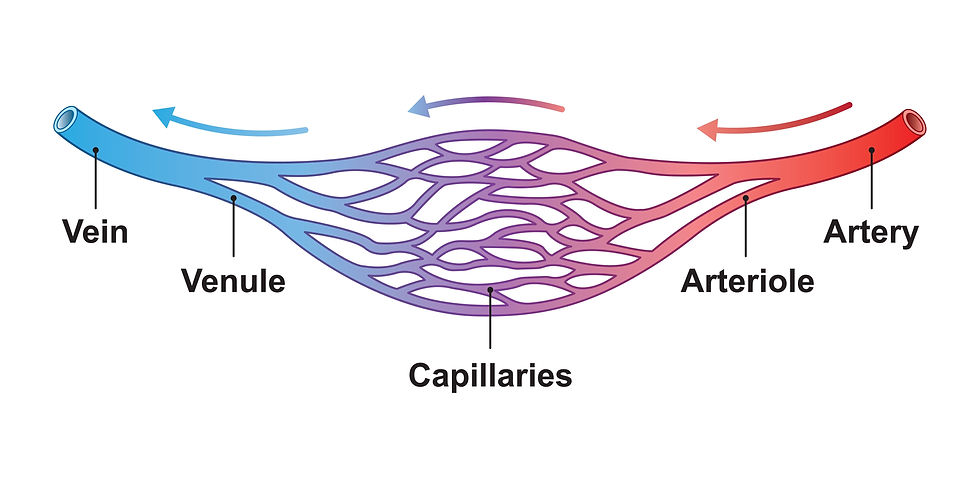
Figure 14. Arteriole graphic © Ali DM/Shutterstock.com.
HRV can be a health index (Shaffer & Ginsburg, 2017). Monitoring HRV can help assess stress levels and recovery in clients (Kim et al., 2018). By evaluating HRV, practitioners can tailor exercise and rehabilitation programs more effectively (Plews et al., 2013). Finally, variations in HRV can predict potential cardiac events and monitor chronic conditions such as heart failure (Thayer et al., 2010).
Clinical takeaway: Recognizing that a healthy heart does not beat like a metronome and instead has variable rhythms helps better assess cardiovascular health, personalize stress management and exercise programs, and predict and monitor cardiac events. This leads to more effective and individualized client care.
HRV Measurements
We will cover six HRV measurement myths: 4. Very-low-frequency (VLF) increases during HRV biofeedback training are sympathetic. 5. Low-frequency (LF) power measurements during rest contain a sympathetic component. 6. High-frequency (HF) power measurements during slow-paced breathing are valid. 7. We can directly compare HRV recordings of different lengths. 8. HRV measurements are stable throughout the day. 9. You should trust smartphone HRV app values.

Myth 4. Very-low-frequency (VLF) increases during HRV biofeedback training are sympathetic.
The very-low-frequency (VLF) band (0.0033-0.04 Hz) comprises rhythms with periods between 25 and 300 seconds. There is uncertainty regarding the physiological mechanisms responsible for activity within this band (Kleiger et al., 2005).
Excessive effort during HRV biofeedback training can trigger vagal withdrawal (parasympathetic inhibition). Contrary to popular belief, the fight-or-flight response (i.e., sympathetic activation) occurs in response to threats to our survival, as opposed to mild stressors. Everyday stressors cause vagal withdrawal instead of sympathetic activation (Porges et al., 2010), as shown in Figure 15.
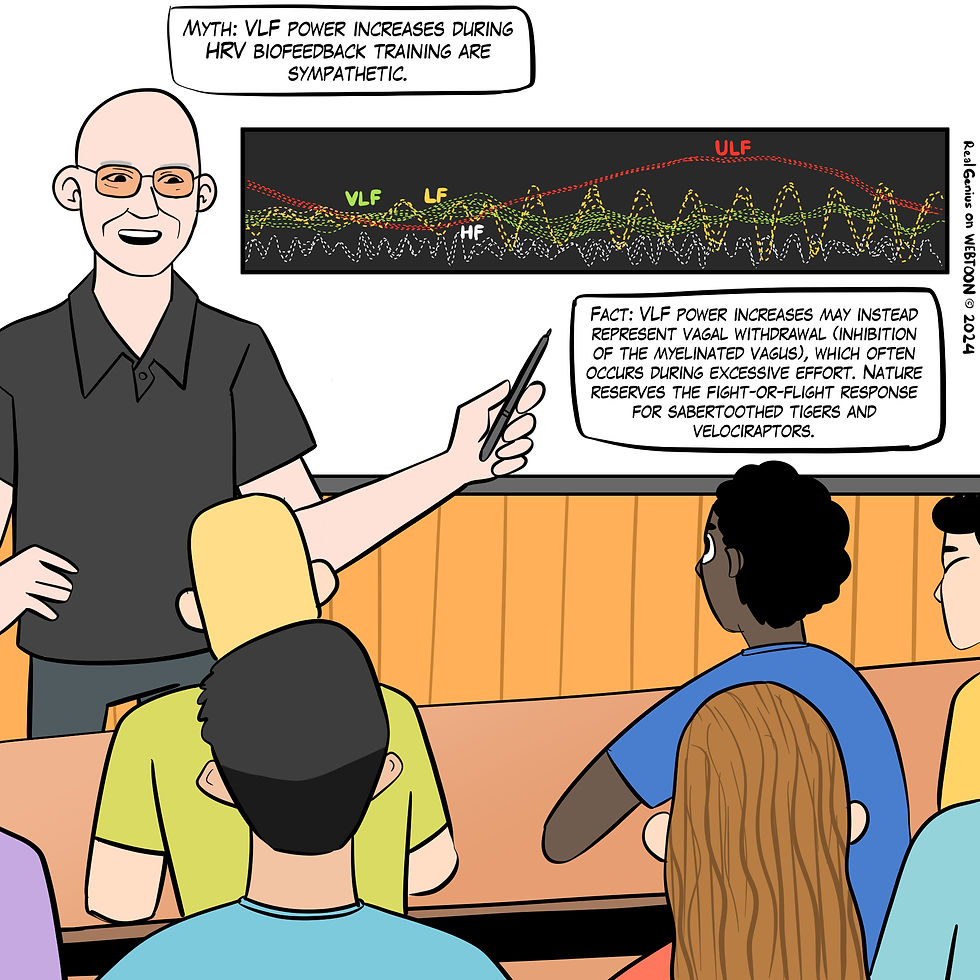
Figure 15. The "VLF power increases during HRV biofeedback training are sympathetic" myth. Real Genius episode by Dani S at Fiverr.com.
Clinical takeaway: Studies using pharmacological blockades (e.g., beta-blockers for SNS blockade and atropine for PNS blockade) demonstrate that changes in HRV components can be linked specifically to either vagal or SNS modulation (Pomerantz et al., 1985).
Interventions targeting autonomic dysfunctions need to address the specific imbalance. For instance, treatments enhancing PNS activity (like HRV biofeedback) may be more effective for HR increases due to vagal withdrawal.
Conversely, if SNS activation is the cause, interventions might focus on reducing SNS activity (e.g., stress management; Thayer & Lane, 2007).
Myth 5. Low-frequency (LF) power measurements during rest contain a sympathetic component.
The low-frequency (LF) band (0.04-0.15 Hz) comprises rhythms with periods between 7 and 25 seconds and is affected by breathing from ~3-9 breaths per minute (bpm). LF power increases during slow-paced breathing (SPB) and slow-paced contraction (SPC), likely reflecting baroreceptor and parasympathetic, but not sympathetic, activity.
Significant variability in sympathetic activity at rest among individuals suggests that the low-frequency/high-frequency (LF/HF) ratio may not be a reliable marker for assessing autonomic balance in a resting state (Schlindwein et al., 2008). The controversy over the LF/HF ratio at rest stems from its inaccurate reflection of sympathetic activity and the complex interplay between sympathetic and parasympathetic influences. This ratio should be interpreted cautiously, especially in resting conditions (Reyes del Paso et al., 2013), where there may be no sympathetic activity, as shown in Figure 16.
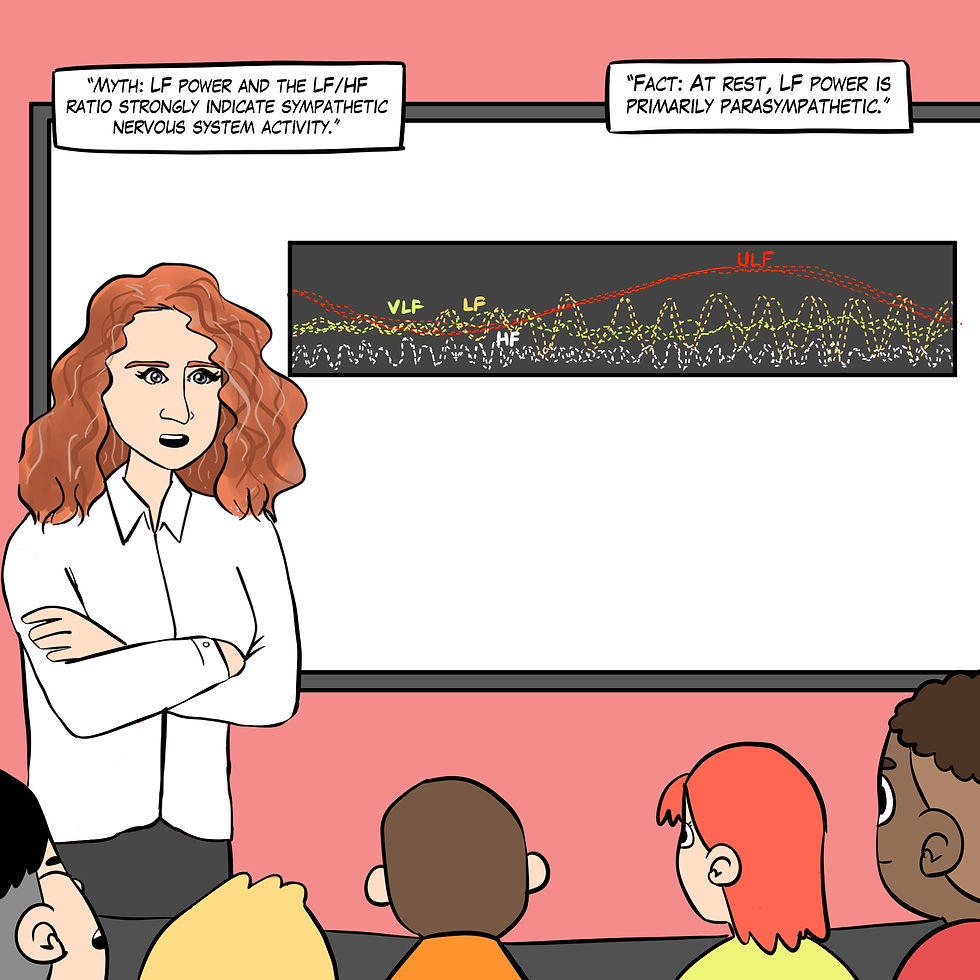
Figure 16. The "LF power and the LF/HF ratio are sympathetic" myth. Real Genius episode by Dani S at Fiverr.com.
Clinical takeaway: Unless HRV measurement protocols have been shown to increase SNS activity reliably (e.g., exercise or the Trier Social Stress Test (TSST); Kirschbaum et al., 1993), clinicians should not use the LF/HF ratio to assess autonomic balance.
Myth 6. High-frequency (HF) power measurements during slow-paced breathing are valid.
The high-frequency (HF) band (0.15-0.40 Hz) is influenced by breathing from 9-24 bpm (Task Force, 1996). HF measurements are invalid during SPB. Slow breathing shifts the spectral power from HF to LF bands, complicating the interpretation of autonomic regulation. This inaccurately represents autonomic balance when using HF-HRV as a measure (Sasaki & Maruyama, 2014) and cannot serve as a proxy for vagal tone (Kromenacker et al., 2018), as shown in Figure 17.
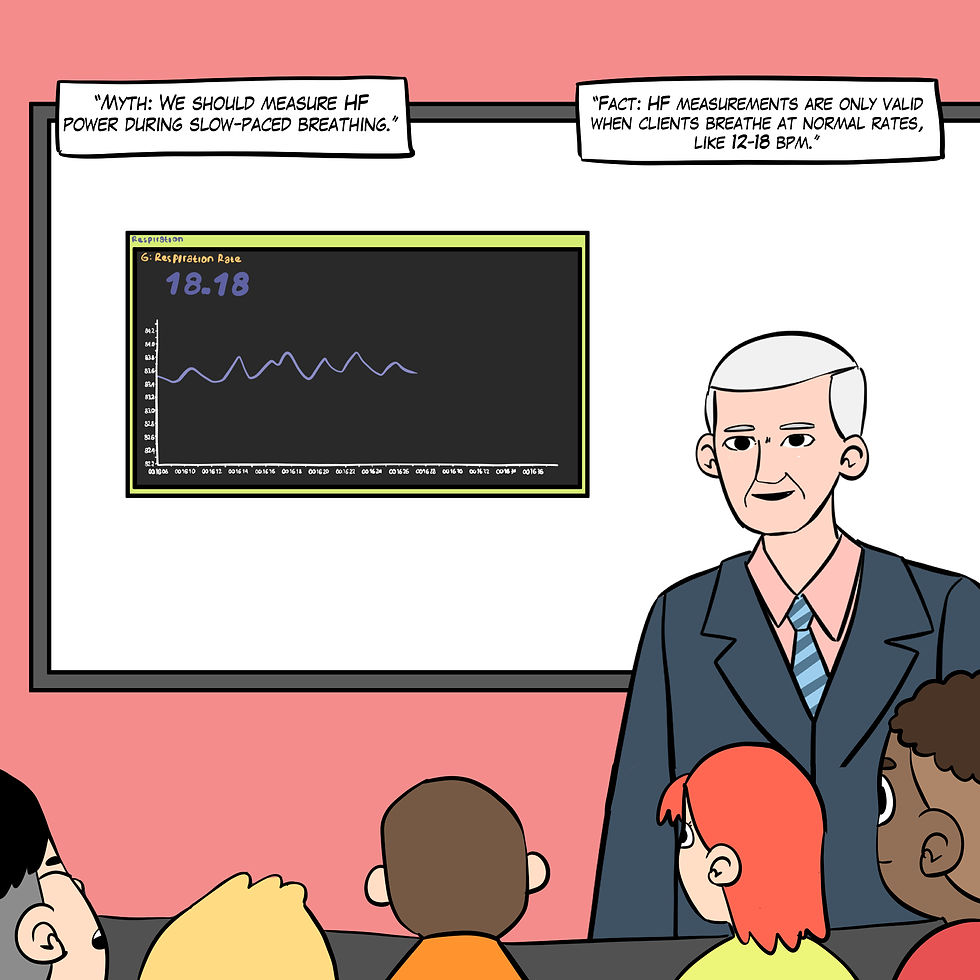
Figure 17. The "We should measure HF power during slow-paced breathing" myth. Real Genius episode by Dani S at Fiverr.com.
Clinical takeaway: Only measure HF power when clients breathe at normal rates.
Myth 7. We can directly compare HRV recordings of different lengths.
The recording period significantly affects both HRV time- and frequency-domain measurements. Cycle-length dependence prevents directly comparing 5- and 10-minute recordings because longer recording periods can capture more variability (Pomeranz et al., 1985), as shown in Figure 18.
Resting values obtained from brief monitoring periods can dramatically underestimate HRV, correlating poorly with 24-hour indices.
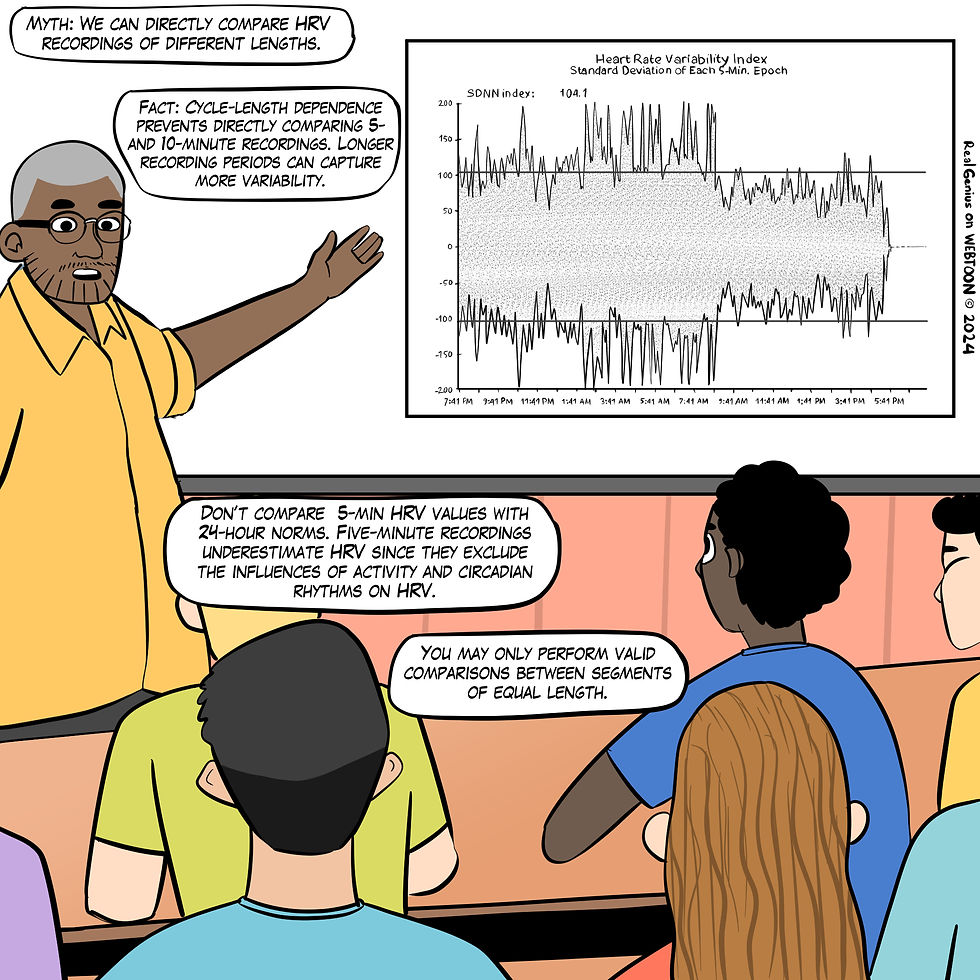
Figure 18. The "We can directly compare HRV recordings of different lengths" myth. Real Genius episode by Dani S at Fiverr.com.
Clinical takeaway: Only compare HRV measurements of identical length. Longer recording periods can inflate HRV values compared to shorter epochs.
Myth 8: HRV measurements are stable throughout the day.
Resting HRV measurements vary significantly from morning to evening, with higher RMSSD and SDNN values typically observed in the morning (Armstrong et al., 2011).

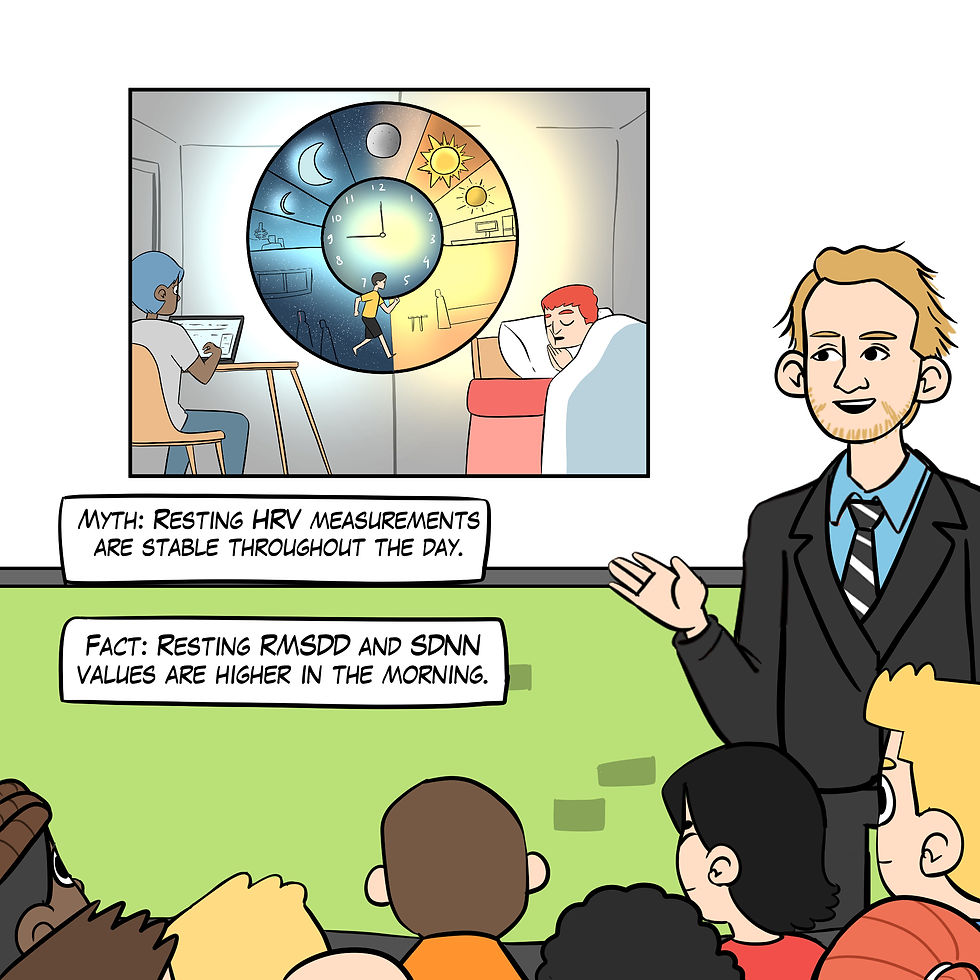
Figure 19. The "Resting HRV measurements are stable throughout the day" myth. Real Genius episode by Dani S at Fiverr.com.
Clinical takeaway: Measure resting HRV at the same time each day.
Myth 9. You should trust smartphone HRV app values.
HRV time- and frequency-domain values obtained from smartphone apps may be invalid due to their failure to control artifacts, as shown in Figure 20. Popular HRV apps may not perform even minimal data cleaning. They can be overwhelmed by abnormal beats like premature atrial contractions (PACs). Significant but small differences in HRV metrics were observed when no artifact correction was applied in the seated position, and trivial differences were seen in the supine position (Himariotis et al., 2022). HRV smartphone apps without error correction can be valid for time-domain HRV indices, but at least 3 minutes are needed for accurate frequency-domain measurements (Chen et al., 2020).

Figure 20. The "You should trust smartphone HRV app values" myth. Real Genius episode by Dani S at Fiverr.com.
Clinical takeaway: Distrust values that exceed age-related norms by two or more standard deviations. For example, the 142-ms root mean square of successive differences (RMSSD) value for a 75-year-old male is 110 ms too high. Record data for at least 3 minutes. Manual data artifacting of smartphone app data within programs like CardioPro and Kubios is the gold standard. This is crucial when cardiac arrhythmias (Pipitprapat et al., 2018) are present or when recording HRV during intense aerobic activity (Lee et al., 2017).
Myth 10. HRV measures acute life stress.
HRV is not an acute stress detector. Full stop. Marco Altini explained why wearables cannot reliably measure acute stressors in a recent HRV4Training post:
When we consider data that were not collected according to best practices for assessment of resting physiology (i.e. data that was not collected first thing in the morning or during the night), we need to remember that physical movement remains by far the main factor behind changes in heart rate and its variability (which is why physiology should be measured at rest, far from stressors). It doesn’t matter if you are resting when you measure it. Even if you are working at the office, if you were active hours before, physical activity will lead to changes in your physiology that are much larger than changes due to mental/psychological stress, which is another reason why it is impossible to build a ‘stress monitor’ that actually reflect what most of us perceive as stress. Acute physiological stress due to exercise will override most other stressors, and most importantly, it is not bad, but it gets interpreted that way by wearables that can only provide overly simplistic interpretations.
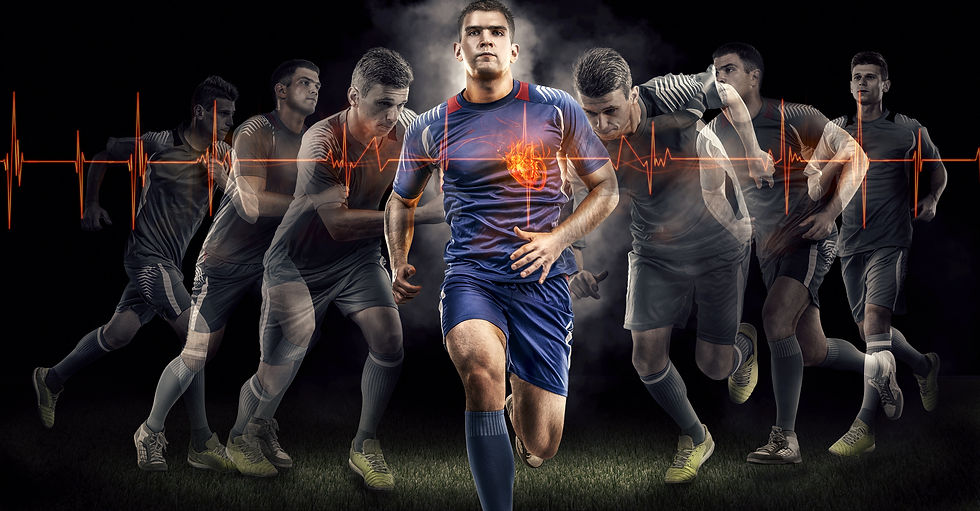
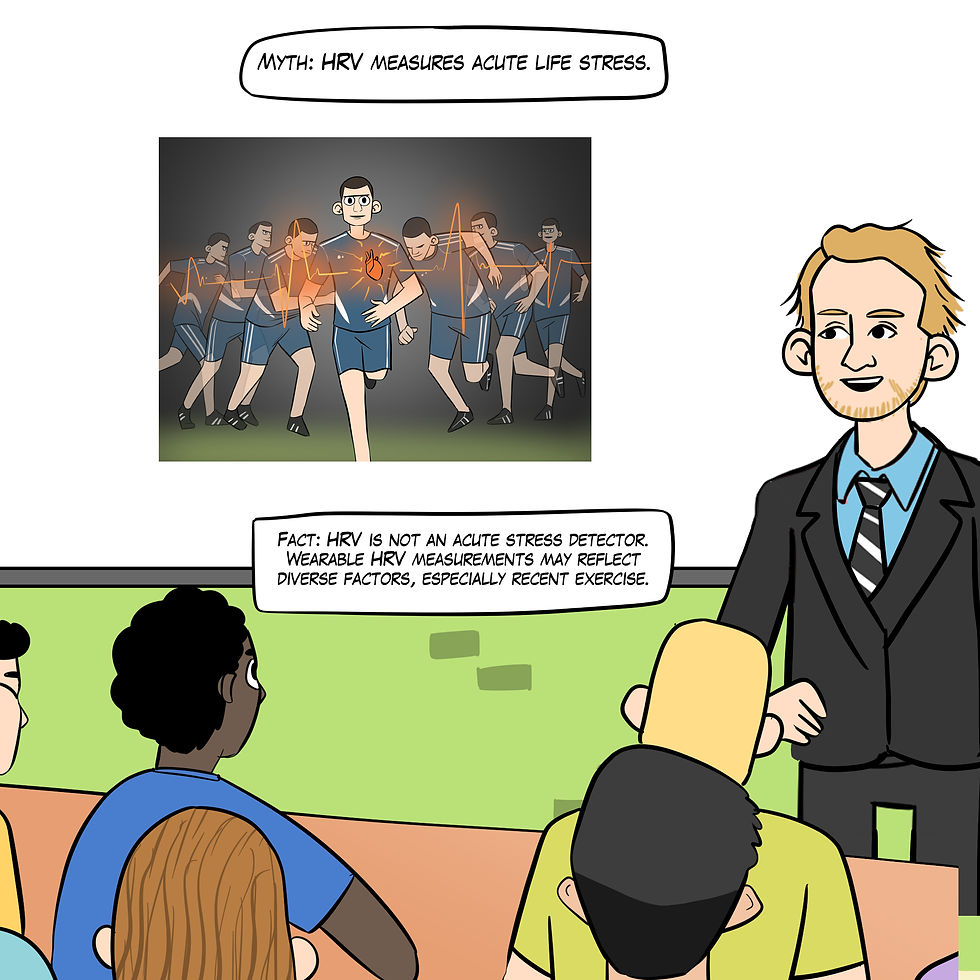
Figure 21. The "HRV measures acute life stress" myth. Real Genius episode by Dani S at Fiverr.com.
Clinical takeaway: Recognize that optical sensors are inaccurate and that changes in wearable HRV measurements may reflect diverse factors, including exercise hours before. Instruct your clients to use best practices when measuring daily HR and HRV and compare daily values with their historical trends. When HR and HRV measurements are several standard deviations above or below their typical scores, invite them to explore potential causes of this discrepancy.
HRV Biofeedback Training
We will cover seven myths: 11. Try to relax. 12. Take deep breaths. 13. Slow-paced breathing is the best way to increase HRV. 14. Successful HRV biofeedback training always produces a 0.1 Hz LF peak. 15. When slow-paced breathing increases HR oscillations, this signals greater vagal tone. 16. The best sign of HRV training success is high resting LF power. 17. HRV biofeedback asks clients to slow their daily breathing permanently. 18. Breathe deeply to relax.
Myth 11. Try to relax.
When clients try too hard to slow their breathing during HRV biofeedback practice, they can trigger vagal withdrawal, as shown in Figure 19. Excessive effort may increase VLF power (García-González et al., 2000) and produce unwanted autonomic changes such as increased skin conductance (Mayskov et al., 2022) and decreased skin temperature (Zhang & Yan, 2001).

Figure 22. The "Try to relax" myth. Real Genius episode by Dani S at Fiverr.com.
Clinical takeaway: SPB instructions should encourage passive volition using words like "allow." When you observe VLF increases during an HRVB trial, look for respiration rates below 2.4 bpm (Task Force, 1996) and ask your client about their perceived effort. Encourage them to breathe effortlessly (Peper & Tibbets, 1994).
Myth 12. Take deep breaths since we need more oxygen.
At rest, we do not need more oxygen! Near sea level, the air we inhale contains 21% oxygen, whereas the air we exhale contains 15% oxygen. We only use one-fourth of inhaled air, as shown in Figure 23.
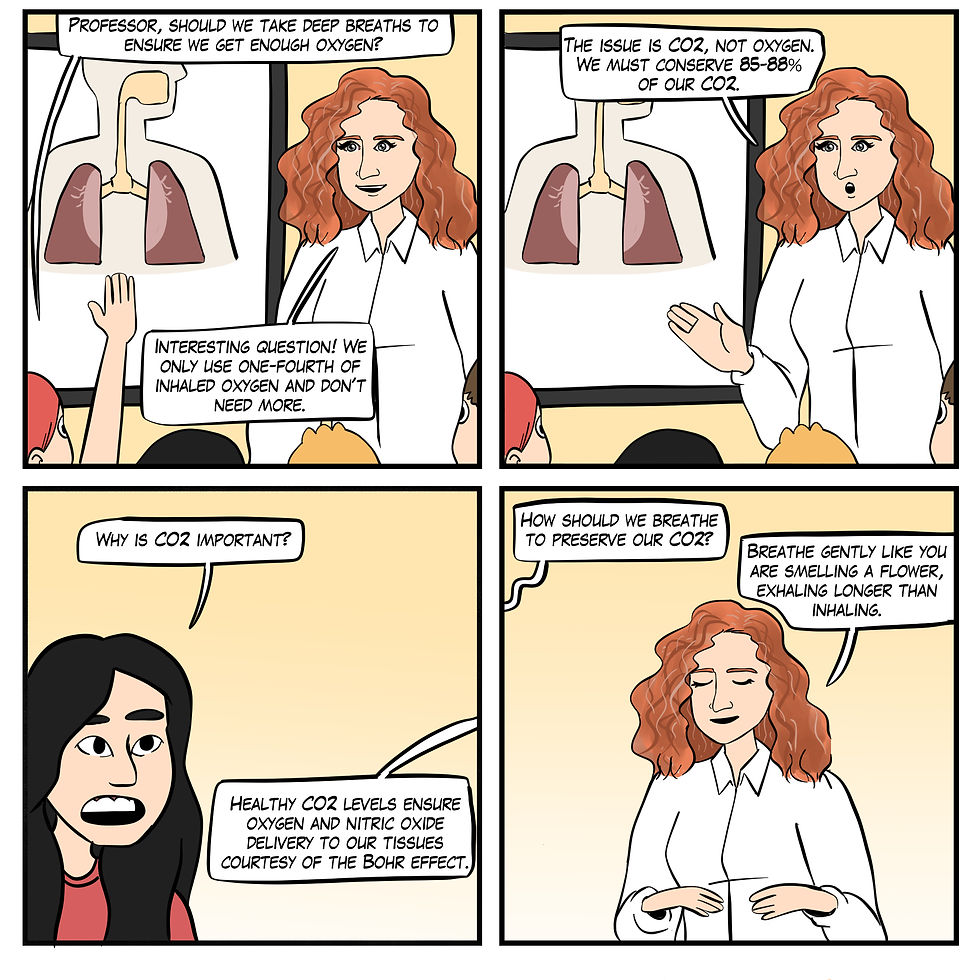
Figure 23. The "Take deep breaths since we need more oxygen" myth. Real Genius episode by Dani S at Fiverr.com.
Clinical takeaway: Don't use the word deep. Encourage your clients to inhale gently as if they are smelling a flower.
Myth 13. Slow-paced breathing is the best way to increase HRV.
Slow-paced muscle contraction (SPC) offers an alternative to slow-paced breathing (SPB), which can be challenging (e.g., chronic pain) or medically contraindicated (e.g., kidney disease). In SPC, clients may contract wrists and ankles or wrists, core, and ankles for 3 seconds from 4.5-6.5 contractions per minute (cpm) with feet supported by a second chair. The contractions should be gentle (Meehan & Shaffer, 2024; see Figure 24).

Shaffer, Moss, and Meehan (2022) reported that 1- and 6-cpm SPC increased several HRV metrics (e.g., the RMSSD, SDNN, and low-frequency power) to a greater degree than SPC at 12 cpm. Wrist-core-ankle SPC increased mean RSA (HR Max-HR Min) more than wrist-ankle SPC or a resting baseline condition (Meehan & Shaffer, 2023).

Figure 24. The "Slow-paced breathing is the best way to increase HRV" myth. Real Genius episode by Dani S at Fiverr.com.
Clinical takeaway: SPC provides an alternative HRV biofeedback training option when SPB is difficult due to chronic pain or dysfunctional breathing or contraindicated by metabolic (Kim, 2021; Kitabchi et al., 2009) or respiratory acidosis (Epstein & Singh, 2001). Metabolic acidosis occurs when the body produces too much acid or when the kidneys are not removing enough acid from the body. This condition decreases blood pH.
Respiratory acidosis occurs when the lungs cannot remove enough carbon dioxide (CO2) from the body. CO2 accumulates, lowering blood pH.
Acidosis disrupts normal cellular function and metabolic processes, compromising the body's ability to maintain a stable internal environment and threatening safety.
Myth 14. Successful HRV biofeedback training always produces a 0.1 Hz LF peak.
If you train your client using a resonance frequency protocol, their target breathing rate might fall between 4.5-6.5 bpm for adults; as high as 8 bpm for children (Lehrer et al., 2000). The resonance frequency (RF) is the frequency at which a system, like the cardiovascular system, can be maximally activated or stimulated. The peak frequency (e.g., the highest amplitude frequency) depends on your client's breathing rate. Although breathing at 6 bpm yields a 0.1 Hz peak (6/60 = 0.1 Hz), 5 bpm creates a 0.08 Hz peak (5/60 = 0.083 Hz), as shown in Figure 25.
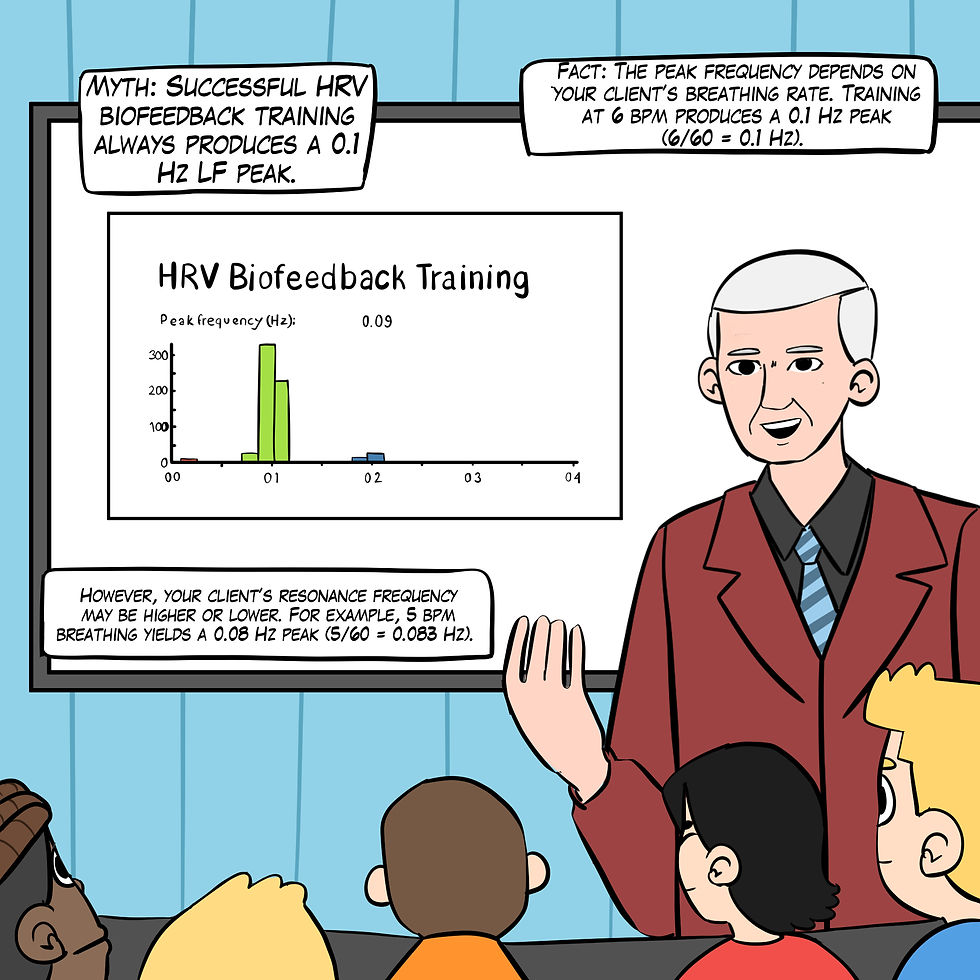
Figure 25. The "Successful HRV biofeedback training always produces a 0.1-Hz LF peak" myth. Real Genius episode by Dani S at Fiverr.com.
Clinical takeaway: Clinicians should not expect a 0.1-Hz peak if their clients' resonance frequency lies above or below 6 bpm.
Myth 15. When slow-paced breathing increases HR oscillations, this signals greater vagal tone.
Slowing breathing to the resonance frequency range increases RSA (Vaschillo et al., 2006). Increased RSA immediately exercises the baroreflex without changing vagal tone. Changing vagal tone or tightening BP regulation requires weeks to months of practice to produce necessary autonomic adaptations (Lehrer & Gevirtz, 2014).
HRV biofeedback can immediately increase RSA 4-10 times compared to a resting baseline (Gevirtz et al., 2016; Vaschillo et al., 2002), as shown in Figure 26.
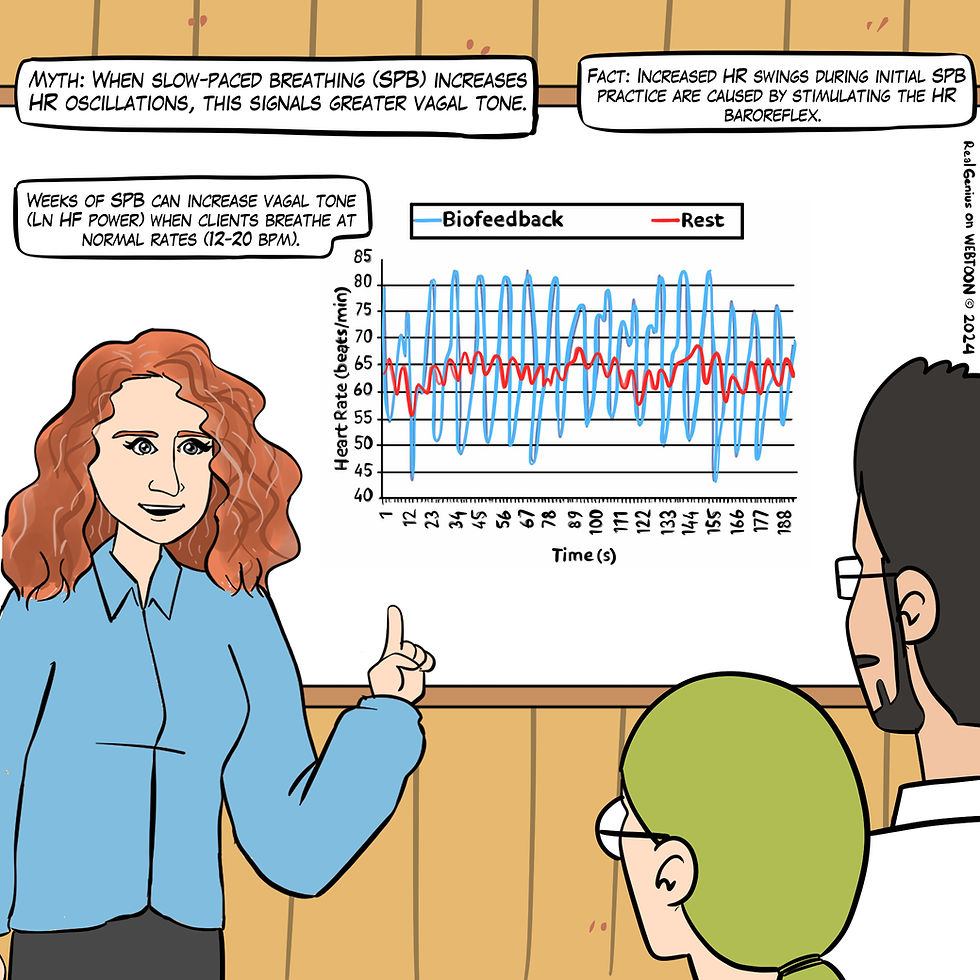
Figure 26. The "When slow-paced breathing increases HR oscillations, this signals greater vagal tone" myth. Graphic adapted from Gevirtz et al. (2016) by Dani S at Fiverr.com.
Clinical takeaway: HRV biofeedback's goal is not increasing RSA; that is a means to the end of increasing vagal tone.
Although initial RSA increases signal that clients have effectively stimulated the baroreflexes, vagal tone increases may take 5 to 8 weeks (Deschodt-Arsac et al., 2020; Schumann et al., 2019).
A combination of weekly supervised HRV biofeedback and 20-minute daily HRV biofeedback practice may be recommended (Lehrer et al., 2000).
Myth 16. The best sign of HRV training success is high resting LF power.
The best sign of HRV training success is high resting HF power when breathing at normal rates (Shaffer & Meehan 2020), as shown in Figure 27. The natural log of HF power is a proxy for vagal tone (Irwin et al., 2006). High resting LF power when breathing between 11-18 bpm may indicate that the vagal brake is stuck.
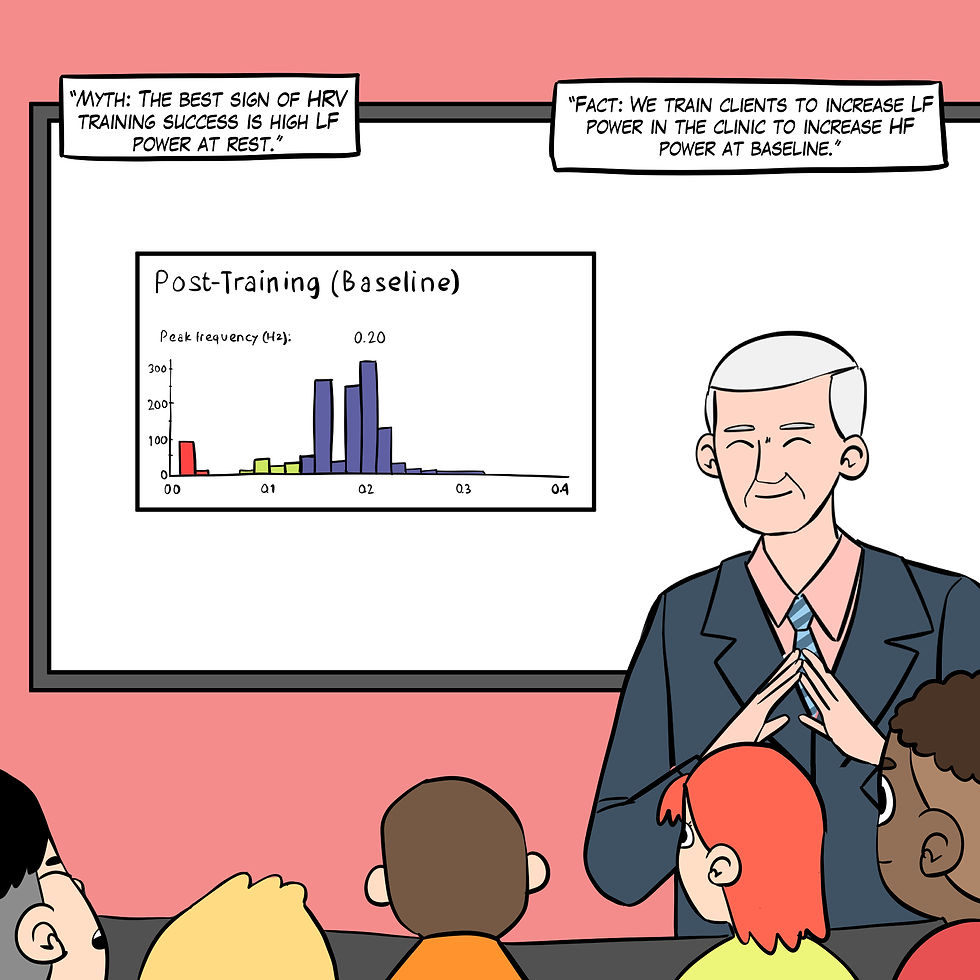
Figure 27. The "The best sign of HRV training success is high resting LF power" myth. Real Genius episode by Dani S at Fiverr.com.
In Figure 28, HF power (dark blue) increased from ~100 μV to ~300 μV from pre-training to post-training baselines. HF power is a proxy for vagal tone when clients breathe normally without feedback.
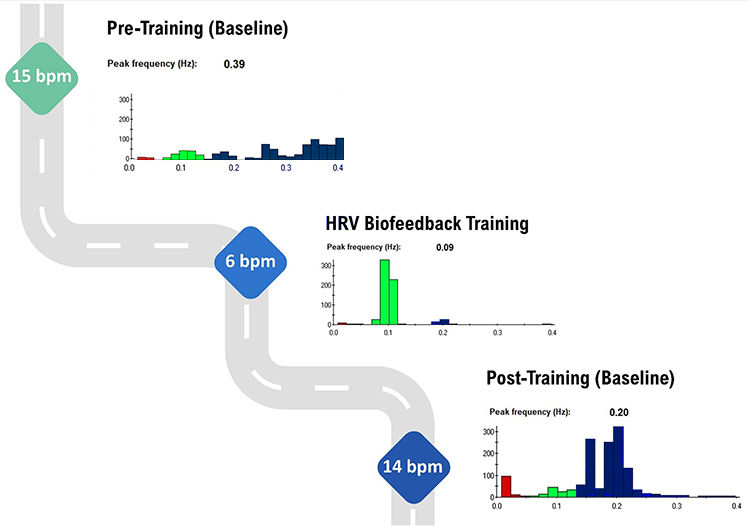
Figure 28. The spectral plots are courtesy of Dr. Inna Khazan. HF power (dark blue) increases from pre-training to post-training baselines.
Clinical takeaway: Gauge client HRV biofeedback training success using HF power.
Myth 17. HRV biofeedback asks clients to slow their daily breathing permanently.
HRV biofeedback training may prescribe SPB practice for up to 20 minutes, one to two times daily. The rest of the time, clients breathe normally, adjusting their breathing to their workloads, as shown in Figure 29.

Figure 269. The "HRV biofeedback asks clients to slow their daily breathing permanently" myth. Real Genius episode by Dani S at Fiverr.com.
It would be counterproductive to curl a dumbbell throughout the day in weightlifting, as shown in Figure 30. Graphic © ra2 studio/Shutterstock.com.

Figure 30. Curling graphic © ra2 studio/Shutterstock.com.
Clinical takeaway: Limit SPB breathing practice to once a day for 20 minutes, building up from 5 minutes daily in the first week. Myth 18. Breathe deeply to relax. Clients should breathe at a comfortable depth (like smelling a flower), exhaling longer than inhaling. Breathing will calm your client when its depth and rate satisfy their resting body’s metabolic needs (Khazan, 2021).

My colleague Dr. Donald Moss no longer uses the word "deep" when coaching breathing (Moss, 2022).

Low-and-slow breathing preserves CO2 by retaining 85-88% of its volume (Khazan, 2021). This promotes optimal oxygen and nitric oxide delivery via hemoglobin. Graphic © Designua/ Shutterstock.com.

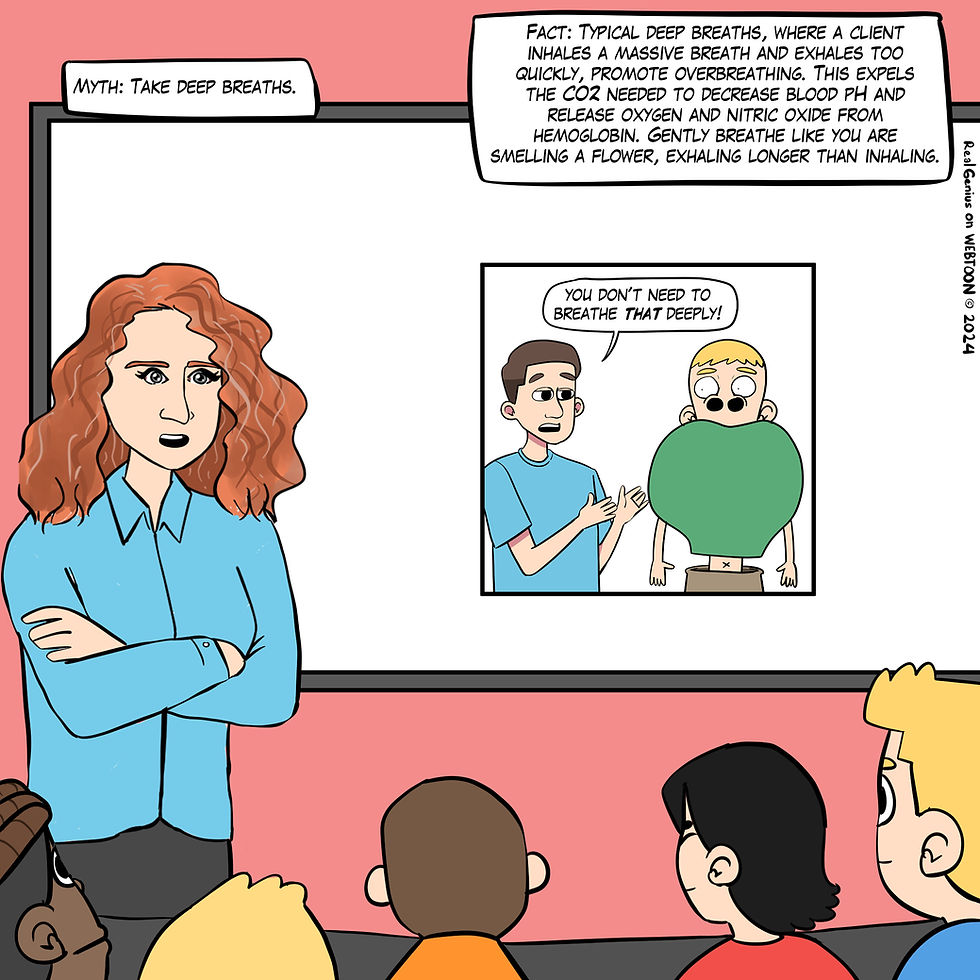
Figure 31. The "Take deep breaths" myth. Real Genius episode by Dani S at Fiverr.com.
Clinical takeaway: Your clients will preserve vital CO2 by inhaling as if they are smelling a flower. This is the genius of Dr. Erik Peper’s effortless breathing.
Conclusion
The exploration of HRV myths and their subsequent debunking serves not only to correct common misconceptions but also to highlight the intricate relationship between HRV and overall health. The evidence presented underscores the importance of accurate HRV interpretation and application in clinical and performance settings. As we advance our understanding of HRV through rigorous research and practice, it becomes crucial to integrate these insights into patient care. Doing so promises to refine diagnostic and therapeutic approaches, fostering a holistic understanding of cardiovascular health that is informed by the dynamic interplay of physiological systems.
Glossary
baroreflex: baroreceptor reflex that provides negative feedback control of BP and HR. Elevated BP activates the baroreflex to lower BP, and lower BP suppresses the baroreflex to raise BP.
cycle-length dependence: the phenomenon where faster HRs reduce the time between successive beats and the opportunity for the interbeat intervals (IBIs) to vary, resulting in lower HRV.
effortless contraction: SPC using about 25% of maximum effort.
frequency-domain metrics: the absolute or relative power of the HRV signal within four frequency bands.
heart rate (HR): the number of heartbeats per minute.
heart rate baroreflex: the closed loop encompassing the cardiovascular control center, heart rate control system, and blood pressure control system.
heart rate variability (HRV): the beat-to-beat changes in HR involving changes in the RR intervals between consecutive heartbeats.
heart rate variability (HRV) biofeedback: the display of beat-to-beat changes in HR, including changes in the RR intervals between consecutive heartbeats to a client.
high-frequency (HF) band power: signal energy in the 0.15-0.40 Hz range that represents the inhibition and activation of the vagus nerve by breathing (respiratory sinus arrhythmia).
HR Max-HR Min: the average difference between the highest and lowest HRs during each respiratory cycle.
HRV time-domain indices: calculating the amount of variability in interbeat interval measurements.
interbeat intervals (IBIs): the time intervals between the peaks of successive R-spikes (initial upward deflections in the QRS complex).
low-frequency (LF) band power: a HRV frequency range of 0.04-0.15 Hz that may represent the influence of PNS and baroreflex activity (when breathing at the RF).
metabolic acidosis: an accumulation of acid or a significant loss of bicarbonate from the body. This condition lowers the blood pH below normal levels. It can result from kidney failure, diabetic ketoacidosis, lactic acidosis, or ingestion of toxins like methanol.
NN intervals: the time between successive heartbeats initiated by the sinoatrial node.
peak frequency: the highest-amplitude frequency.
resonance: an amplification process in which an external force causes a closed-loop (negative feedback) system to oscillate with greater amplitude at its inherent resonance frequency (RF).
resonance frequency: the frequency at which a system, like the cardiovascular system, can be maximally activated or stimulated.
respiratory acidosis: inadequate ventilation, leading to a buildup of carbon dioxide (CO2) in the blood. Increased CO2 results in a decrease in blood pH. It can be due to conditions such as chronic obstructive pulmonary disease (COPD), severe asthma, or drug-induced respiratory depression.
respiratory sinus arrhythmia (RSA): the respiration-driven heart rhythm that contributes to the high-frequency (HF) component of heart rate variability. Inhalation inhibits vagal nerve slowing of the heart (increasing HR), while exhalation restores vagal slowing (decreasing HR).
RMSSD: the square root of the mean squared difference of adjacent NN intervals.
RR intervals: the time between successive heartbeats.
SDNN: the standard deviation of the normal (NN) sinus-initiated IBI measured in milliseconds.
slow-paced breathing (SPB): breathing in the adult 4.5-6.5 bpm range.
slow-paced breathing (SPB): breathing in the adult 4.5-6.5 bpm range.
slow-paced contraction (SPC): wrist-ankle or wrist-core-ankle contraction in the
adult 4.5-6.5 cpm range.
tilt table: a flat surface on which the patient lies, secured with straps to prevent falling. The table can be gradually tilted from a horizontal to a vertical position, allowing the patient to experience controlled weight-bearing.
time-domain metrics: HRV indices that quantify the amount of variability in IBI measurements.
vagal tone: parasympathetic activity, which is estimated by the natural log of HF power.
vagus nerve: the parasympathetic vagus (X) nerve decreases the rate of spontaneous depolarization in the SA and AV nodes and slows HR. HR increases often reflect reduced vagal inhibition.
vagal withdrawal: the reduction or removal of parasympathetic nervous system activity, specifically the influence of the vagus nerve on the heart. This increases heart rate and reduces heart rate variability, often in response to stress or physical activity.
Vaschillo’s two closed-loop model: the heart rate (HR) and vascular tone (VT) baroreflexes are closed loops; stimulating one closed loop activates its counterpart. Each baroreflex is a potential target for HRV biofeedback training. SPB and SPC at ~ 6 bpm/cpm can stimulate the HR baroreflex, separately or synergistically. SPC at ~ 1 cpm can activate the VT baroreflex.
vascular tone (VT) baroreflex: negative feedback loop that regulates resistance blood vessel diameter with a 15-second delay and 0.03 Hz resonance frequency.
References
Armstrong, R., Kenny, G., Green, G., & Seely, A. (2011). Diurnal variation in heart rate variability before and after maximal exercise testing. Chronobiology International, 28, 344 - 351. https://doi.org/10.3109/07420528.2011.559674 Camillo, C., Laburu, V., Gonçalves, N., Cavalheri, V., Tomasi, F., Hernandes, N., Ramos, D., Vanderlei, L., Ramos, E., Probst, V., & Pitta, F. (2011). Improvement of heart rate variability after exercise training and its predictors in COPD. Respiratory Medicine, 105(7), 1054-62. https://doi.org/10.1016/j.rmed.2011.01.014
Chen, Y., Lu, W., Pagaduan, J., & Kuo, C. (2020). A novel smartphone app for the measurement of ultra–short-term and short-term heart rate variability: Validity and reliability study. JMIR Mhealth Uhealth, 8(7), e18761. https://doi.org/10.2196/preprints.18761
Conder, R., & Conder, A. (2014). Heart rate variability interventions for concussion and rehabilitation. Frontiers in Psychology, 5. https://doi.org/10.3389/fpsyg.2014.00890
Dan, T., Yeheng, H., Alistair, C., Roger, A., Rashmi, S., Yang, G., & Baker, J. S. (2022). The benefits of heart rate variability (HRV) in the assessment of health and exercise performance. Imaging Journal of Clinical and Medical Sciences, 9(1), 11-14. https://doi.org/10.17352/2455-8702.000136
Deschodt-Arsac, V., Blons, E., Gilfriche, P., Spiluttini, B., & Arsac, L. (2020). Entropy in heart rate dynamics reflects how HRV-biofeedback training improves neurovisceral complexity during stress-cognition interactions. Entropy, 22. https://doi.org/10.3390/e22030317
Epstein, S. K., & Singh, N. (2001). Respiratory acidosis. Respiratory Care, 46(4), 366–383.
García-González, M. A., Vázquez-Seisdedos, C., & Pallàs-Areny, R. (2000). Variations in breathing patterns increase low-frequency contents in HRV spectra. Physiological Measurement, 21(3), 417-423. https://doi.org/10.1088/0967-3334/21/3/307
Gevirtz, R. (2013). The promise of heart rate variability biofeedback: Evidence-based applications. Biofeedback, 41(3), 110-120. https://psycnet.apa.org/doi/10.5298/1081-5937-41.3.01
Gevirtz, R. N. (2020). The myths and misconceptions of heart rate variability. AAPB Annual Meeting.
Gevirtz, R. N., Lehrer, P. M., & Schwartz, M. S. (2016). Cardiorespiratory biofeedback. In M.S. Schwartz & F. Andrasik (Eds.). Biofeedback: A practitioner’s guide (4th ed.). The Guilford Press. Giese-Davis, J., Wilhelm, F., Tamagawa, R., Palesh, O., Neri, E., Taylor, C., Kraemer, H., & Spiegel, D. (2015). Higher vagal activity as related to survival in patients with advanced breast cancer: An analysis of autonomic dysregulation. Psychosomatic Medicine, 77, 346–355. https://doi.org/10.1097/PSY.0000000000000167
Grässler, B., Thielmann, B., Böckelmann, I., & Hökelmann, A. (2021). Effects of different training interventions on heart rate variability and cardiovascular health and risk factors in young and middle-aged adults: A systematic review. Frontiers in Physiology, 12. https://doi.org/10.3389/fphys.2021.657274
Hayano, J., & Yuda, E. (2019). Pitfalls of assessment of autonomic function by heart rate variability. J Physiol Anthropol, 38(1), 3. https://doi.org/10.1186/s40101-019-0193-2. Himariotis, A., Coffey, K., Noel, S., & Cornell, D. (2022). Validity of a smartphone application in calculating measures of heart rate variability. Sensors, 22. https://doi.org/10.3390/s22249883.
Irwin, M., Valladares, E., Motivala, S., Thayer, J., & Ehlers, C. (2006). Association between nocturnal vagal tone and sleep depth, sleep quality, and fatigue in alcohol dependence. Psychosomatic Medicine, 68(1), 159-166. https://doi.org/10.1097/01.psy.0000195743.60952.00
Kamiya, A., Kawada, T., Shimizu, S., Iwase, S., Sugimachi, M., & Mano, T. (2009). Slow head-up tilt causes lower activation of muscle sympathetic nerve activity: Loading speed dependence of orthostatic sympathetic activation in humans. American Journal of Physiology. Heart and Circulatory Physiology, 297(1), H53-58. https://doi.org/10.1152/ajpheart.00260.2009
Khazan, I. (2019). Biofeedback and mindfulness in everyday life. W. W. Norton & Company.
Khazan, I. (2020). The myths and misconceptions of heart rate variability: HRV in biofeedback training. AAPB Annual Meeting.
Khazan, I., Shaffer, F., Moss, D., Lyle, R., & Rosenthal, S. (2023). Evidence-based practice in biofeedback and neurofeedback (4th ed.). Association for Applied Psychophysiology and Biofeedback.
Khazan, I. Z. (2013). The clinical handbook of biofeedback: A step-by-step guide for training and practice with mindfulness. John Wiley & Sons, Ltd.
Kim, H. J. (2021). Metabolic acidosis in chronic kidney disease: Pathogenesis, clinical consequences, and treatment. Electrolyte & blood pressure: E & BP, 19(2), 29–37. https://doi.org/10.5049/EBP.2021.19.2.29
Kim, H. G., Cheon, E. J., Bai, D. S., Lee, Y. H., & Koo, B. H. (2018). Stress and heart rate variability: A meta-analysis and review of the literature. Psychiatry Investigation, 15(3), 235–245. https://doi.org/10.30773/pi.2017.08.17
Kirschbaum, C., Pirke, K. M., & Hellhammer, D. H. (1993). The 'Trier Social Stress Test'--a tool for investigating psychobiological stress responses in a laboratory setting. Neuropsychobiology, 28(1-2), 76-81. https://doi.org/10.1159/000119004
Kitabchi, A. E., Umpierrez, G. E., Miles, J. M., & Fisher, J. N. (2009). Hyperglycemic crises in adult patients with diabetes. Diabetes Care, 32(7), 1335–1343. https://doi.org/10.2337/dc09-9032
Kleiger, R. E., Stein, P. K., & Bigger, J. T., Jr (2005). Heart rate variability: Measurement and clinical utility. Annals of Noninvasive Electrocardiology: The Official Journal of the International Society for Holter and Noninvasive Electrocardiology, Inc, 10(1), 88–101. https://doi.org/10.1111/j.1542-474X.2005.10101.x
Kromenacker, B. W., Sanova, A., Marcus, F. I., Allen, J. J. B., & Lane, R. D. (2018). Vagal mediation of low-frequency heart rate variability during slow yogic breathing. Psychosomatic Medicine, 80(6), 581-587. https://doi.org/10.1097/PSY.0000000000000603
Laborde, S., Mosley, E., & Mertgen, A. (2018). Vagal tank theory: The three Rs of cardiac vagal control functioning – resting, reactivity, and recovery. Front. Neursci., 12, 458. https://doi.org/10.3389/fnins.2018.00458
Lee, E. S., Lee, J., Joo, M., Kim, J. H., & Noh, S. (2017). Accuracy of heart rate measurement using smartphones during treadmill exercise in male patients with ischemic heart disease. Annals of Rehabilitation Medicine, 41(1), 129-137. https://doi.org/10.5535/arm.2017.41.1.129 Lehrer, P. (2022). My life in HRV biofeedback research. Applied Psychophysiology and Biofeedback, 1-10. https://doi.org/10.1007/s10484-022-09535-5 Lehrer, P. M., & Gevirtz, R. (2014). Heart rate variability: How and why does it work? Frontiers in Psychology. https://doi.org/10.3389/fpsyg.2014.00756
Lehrer, P. M., Vaschillo, E., & Vaschillo, B. (2000). Resonant frequency biofeedback training to increase cardiac variability: Rationale and manual for training. Applied Psychophysiology and Biofeedback, 25(3), 177-191. https://doi.org/10.1023/A:1009554825745
Lehrer, P., Vaschillo, B., Zucker, T., Graves, J., Katsamanis, M., Aviles, M., & Wamboldt, F. (2013). Protocol for heart rate variability biofeedback training. Biofeedback, 41(3), 98-109. https://psycnet.apa.org/doi/10.5298/1081-5937-41.3.08
Lin, G., Xiang, Q., Fu, X., Wang, S., Wang, S., Chen, S., Shao, L., Zhao, Y., & Wang, T. (2012). Heart rate variability biofeedback decreases blood pressure in prehypertensive subjects by improving autonomic function and baroreflex. J. Altern. Complement. Med., 18, 143–152. https://doi.org/10.1089/acm.2010.0607
Maier, S., & Hare, T. (2017). Higher heart-rate variability is associated with ventromedial prefrontal cortex activity and increased resistance to temptation in dietary self-control challenges. The Journal of Neuroscience, 37, 446 - 455. https://doi.org/10.1523/JNEUROSCI.2815-16.2016
Meehan, Z. M., & Shaffer, F. (2023). Adding core muscle contraction to wrist-ankle rhythmical skeletal muscle tension Increases respiratory sinus arrhythmia and low-frequency power. Applied Psychophysiology and Biofeedback, 48(1), 127–134. https://doi.org/10.1007/s10484-022-09568-w
Parati, G., Ochoa, J., Lombardi, C., & Bilo, G. (2013). Assessment and management of blood-pressure variability. Nature Reviews Cardiology, 10, 143-155. https://doi.org/10.1038/nrcardio.2013.1
Peper, E., & Tibbetts, V. (1994). Effortless diaphragmatic breathing. Biofeedback and Self-Regulation, 19(2), 181-189. https://doi.org/10.1007/BF01884010
Pipitprapat, W., Harnchoowong, S., Suchonwanit, P., & Sriphrapradang, C. (2018). The validation of smartphone applications for heart rate measurement. Annals of Medicine, 50(7), 721-727. https://doi.org/10.1080/07853890.2018.1531144
Plews, D. J., Laursen, P. B., Stanley, J., Kilding, A. E., & Buchheit, M. (2013). Training adaptation and heart rate variability in elite endurance athletes: Opening the door to effective monitoring. Sports Medicine, 43(9), 773–781. https://doi.org/10.1007/s40279-013-0071-8 Pomeranz, B., Macaulay, R. J., Caudill, M. A., Kutz, I., Adam, D., Gordon, D., Kilborn, K. M., Barger, A. C., Shannon, D. C., & Cohen, R. J. (1985). Assessment of autonomic function in humans by heart rate spectral analysis. The American Journal of Physiology, 248(1 Pt 2), H151–H153. https://doi.org/10.1152/ajpheart.1985.248.1.H151
Porges, S. W. (2010). Stress and parasympathetic control. Stress Science: Neuroendocrinology, 306-312. Elsevier.
Routledge, F., Campbell, T., McFetridge-Durdle, J., & Bacon, S. (2010). Improvements in heart rate variability with exercise therapy. The Canadian Journal of Cardiology, 26(6), 303-312. https://doi.org/10.1016/S0828-282X(10)70395-0
Reyes del Paso, G. A., Langewitz, W., Mulder, L. J. M., van Roon, A., & Duschek, S. (2013). The utility of low frequency heart rate variability as an index of sympathetic cardiac tone: a review with emphasis on a reanalysis of previous studies. Psychophysiology, 50(5), 477-487. https://doi.org/10.1111/psyp.12027
Sasaki, K., & Maruyama, R. (2014). Consciously controlled breathing decreases the high-frequency component of heart rate variability by inhibiting cardiac parasympathetic nerve activity. The Tohoku Journal of Experimental Medicine, 233(3), 155-163. https://doi.org/10.1620/TJEM.233.155
Schlindwein, P., Buchholz, H. G., Schreckenberger, M., Bartenstein, P., Dieterich, M., & Birklein, F. (2008). Sympathetic activity at rest and motor brain areas: FDG–PET study. Autonomic Neuroscience, 143(1-2), 27-32. https://doi.org/10.1016/j.autneu.2008.07.006
Schumann, A., Köhler, S., Brotte, L., & Bär, K. (2019). Effect of an eight-week smartphone-guided HRV-biofeedback intervention on autonomic function and impulsivity in healthy controls. Physiological Measurement, 40. https://doi.org/10.1088/1361-6579/ab2065. Shaffer, F., McCraty, R., & Zerr, C. L. (2014). A healthy heart is not a metronome: An integrative review of the heart’s anatomy and heart rate variability. Frontiers in Psychology. https://doi.org/10.3389/fpsyg.2014.01040
Shaffer, F., & Meehan, Z. M. (2020). A practical guide to resonance frequency assessment for heart rate variability biofeedback. Frontiers in Neuroscience, 14, 570400. https://doi.org/10.3389/fnins.2020.570400 Shaffer, F., Meehan, Z. M., & Zerr, C. L. (2020). A critical review of ultra-short-term heart rate variability norms research. Frontiers in Neuroscience. https://doi.org/10.3389/fnins.2020.594880
Steffen, P. R., Austin, T., DeBarros, A., & Brown, T. (2017). The impact of resonance frequency breathing on measures of heart rate variability, blood pressure, and mood. Front. Public Health, 5, 222. https://doi.org/10.3389/fpubh.2017.00222 Task Force of the European Society of Cardiology and the North American Society
of Pacing and Electrophysiology (1996). Heart rate variability: Standards of measurement, physiological interpretation, and clinical use. Circulation, 93, 1043-1065. PMID: 8598068
Thayer, J. F., & Lane, R. D. (2007). The role of vagal function in the risk for cardiovascular disease and mortality. Biological Psychology, 74(2), 224-242. https://doi.org/10.1016/j.biopsycho.2005.11.013
Thayer, J. F., Yamamoto, S. S., & Brosschot, J. F. (2010). The relationship of autonomic imbalance, heart rate variability and cardiovascular disease risk factors. International Journal of Cardiology, 141(2), 122–131. https://doi.org/10.1016/j.ijcard.2009.09.543
Vaschillo, E., Lehrer, P., Rishe, N., & Konstantinov, M. (2002). Heart rate variability biofeedback as a method for assessing baroreflex function: A preliminary study of resonance in the cardiovascular system. Applied Psychophysiology and Biofeedback, 27(1), 1-27. https://doi.org/10.1023/a:1014587304314
Vaschillo, E. G., Vaschillo, B., & Lehrer, P. M. (2006). Characteristics of resonance in heart rate variability stimulated by biofeedback. Applied Psychophysiology and Biofeedback, 31(2), 129-142. https://doi.org/10.1007/s10484-006-9009-3
Zhang, X., & Yan, K. (2001). The effects of abdominal breathing and autogenic training on heart rate and finger temperature. Chinese Journal of Clinical Psychology, 115-116.
Support Our Friends at NRBS, ISNR, and AAPB



Comments