
What Are HRV Frequency-Domain Metrics?
Heart rate variability (HRV) frequency-domain metrics quantify the absolute or relative power within four frequency bands. HRV frequency-domain measurements reveal the sources of physiological changes.
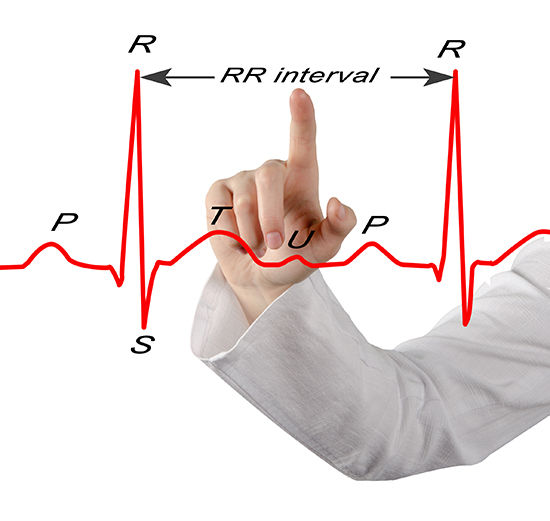
Like time-domain measurements, they are calculated from the interbeat interval (IBI). An IBI is a period between successive heartbeats. It is also called an R-R interval because it is the time between adjacent R-spikes. Graphic © arka38/Shutterstock.com
Click on our narrator icon to listen to this post.
Interbeat Interval Refresher
We measure the time intervals between successive heartbeats in milliseconds (ms). The software starts counting after detecting the first beat and calculates the first IBI in ms after detecting the second beat. This process is repeated until the end of the epoch (data collection period). Graphic adapted from Dr. Richard Gevirtz.
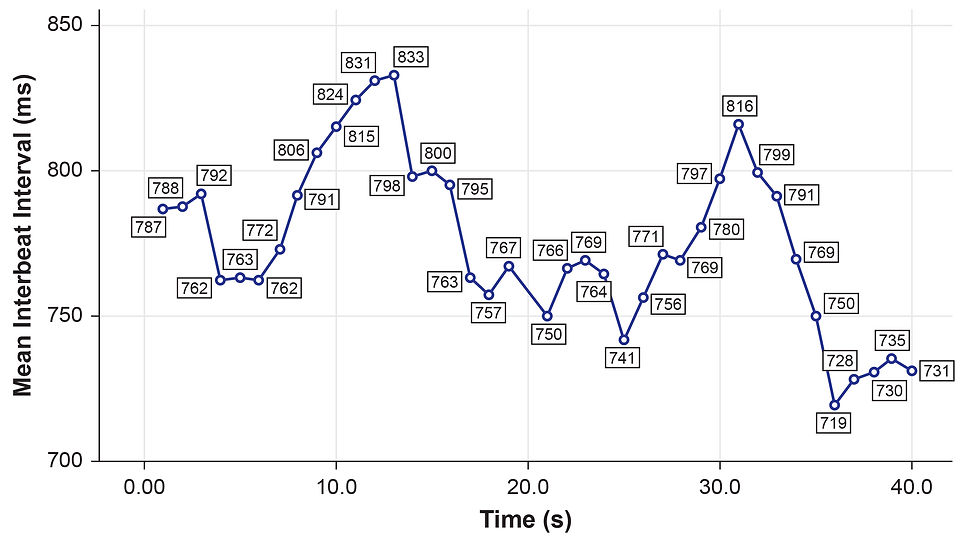
Note: the numbers in boxes are IBIs measured in milliseconds.
What is the Source of HRV Frequency Bands?
The processes that contribute to HRV operate at different speeds and therefore generate different frequencies. Frequency-domain measurements quantify the absolute or relative amount of HRV signal power within each of four frequency bands (ultra-low, very-low-frequency, low-frequency, and high-frequency).
In the graphic below, adapted from Dr. Richard Gevirtz, ultra-low-frequency activity is red, very-low-frequency activity is green, low-frequency activity is yellow, and high-frequency activity is white.

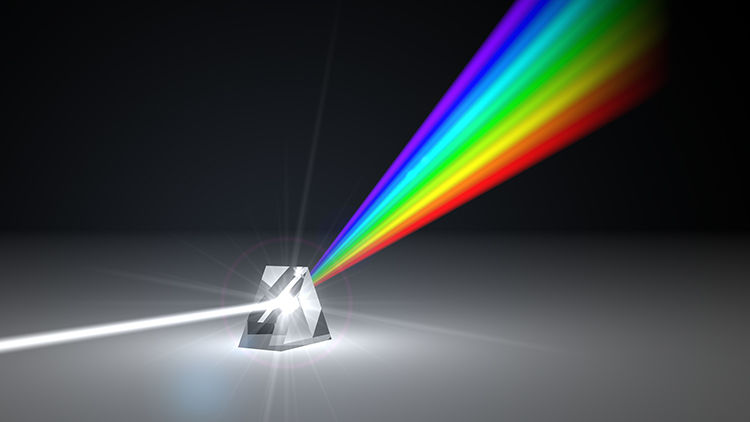
Analogous to the electroencephalogram (EEG), we can use power spectral analysis or autoregressive (AR) modeling to separate HRV into its component rhythms. This is analogous to a prism that refracts light into its component wavelengths. Graphic © kmls/Shutterstock.com.
The Task Force of the European Society of Cardiology and the North American Society of Pacing and Electrophysiology (1996) divided heart rate oscillations into four frequency bands. The very-low-frequency (VLF), low-frequency (LF), and high-frequency (HF) bands are shown below.
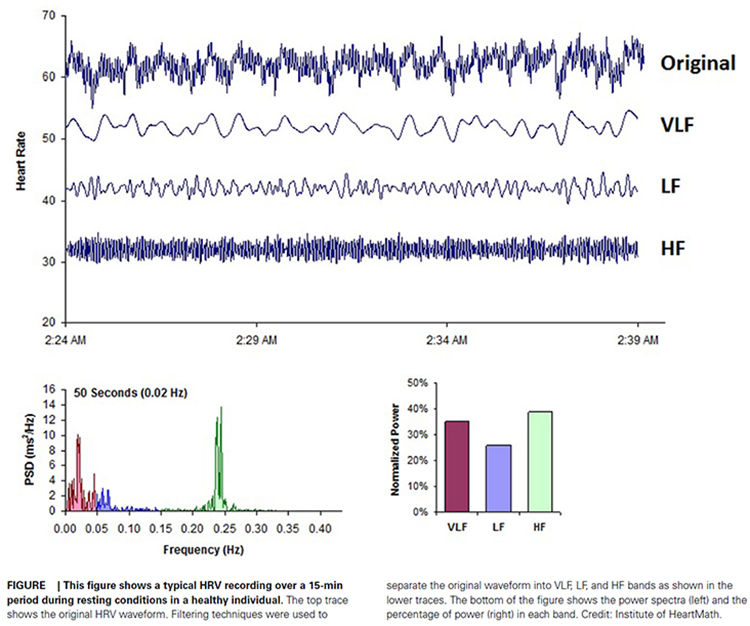
Why does each rhythm operate within a different frequency range? The processes that generate the VLF, LF, and HF bands oscillate with increasing speed (shorter cycles). VLF processes are the slowest, followed by the progressively faster LF and HF processes.
A Few Cautions
Very-low-frequency and high-frequency power measurements are invalid when individuals breathe slowly (e.g., ~ 6 bpm).
We cannot compare HRV frequency-domain values (e.g., low-frequency) obtained during slow-paced breathing to resting norms. Brief resting measurement periods underestimate 24-hour frequency-domain values. Finally, consumers should exercise caution in interpreting smartphone time-domain values because apps either do not artifact or perform limited data clean-up.
To address this problem, export text file data from the device software to additional analysis software.

Kubios Standard, which is freeware, allows automatic and manual artifact correction, and reports an extensive range of time- and frequency-domain metrics.

Overview
We will cover the ultra-low-frequency (ULF), very-low-frequency (VLF), low-frequency (LF), and high-frequency (HF) bands. In addition, we will examine the problems with the controversial LF/HF ratio. Researchers express absolute power in ms squared divided by cycles per second (ms2/Hz). Relative power is a frequency band’s percentage of total HRV power. We can express this in normal units (nu) by dividing the absolute power for a specific frequency band by the summed absolute power of the low-frequency (LF) and high-frequency (HF) bands.
While normal units allow us to compare the spectral distribution in two clients directly, they conceal the actual contributions of each frequency band to HRV (Gevirtz, 2020). Journals now prefer the natural logs of LF and HF power. A natural log expresses a value to the base e. The irrational mathematical constant e ≈ 2.71828.
The autonomic contribution to the ultra-low-frequency (ULF), very-low-frequency (VLF), and low-frequency (LF) bands remains controversial since measurements profoundly vary with testing conditions (Lehrer, 2012).
Ultra-Low-Frequency Band
The ultra-low-frequency (ULF) band (≤ 0.003 Hz) indexes fluctuations in interbeat intervals with a period from 5 minutes to 24 hours. The ULF band is measured using 24-hour recordings (Kleiger et al., 2005). Due to its long cycle length (> 5 hours), ULF activity is too gradual to train using conventional biofeedback (Stauss, 2003).
ULF Sources
There is no consensus regarding the mechanisms that generate ULF power. Very slow-acting biological processes are implicated. Circadian rhythms may be the primary driver of this rhythm (Shaffer, McCraty, & Zerr, 2014).
Core body temperature, metabolism, and the renin-angiotensin system operate over a long period and may also contribute to these frequencies (Task Force, 1996; Bonaduce et al., 1994).
There is disagreement about the contribution of the PNS and SNS to this band.
ULF Correlates
ULF power is highly correlated with the SDANN time-domain index (Bigger et al., 1992).
Very-Low Frequency Band
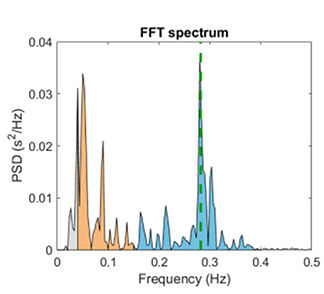
The very-low-frequency (VLF) band (0.0033-0.04 Hz) comprises rhythms with periods between 25 and 300 seconds. VLF measurement requires a recording period of at least 5 minutes but may be best monitored over 24 hours (Task Force, 1996). In the FFT spectral plot, VLF power is colored gray. The graphic is courtesy of Kubios Oy (2022).
VLF Sources
There is uncertainty regarding the physiological mechanisms responsible for activity within this band (Kleiger et al., 2005). The heart's intrinsic nervous system appears to contribute to the VLF rhythm, and the SNS influences the amplitude and frequency of its oscillations (Shaffer, McCraty, & Zerr, 2014).
VLF power may also be generated by physical activity (Bernardi et al., 1996), thermoregulatory, renin-angiotensin, and endothelial influences on the heart (Akselrod et al., 1981; Claydon & Krassioukov, 2008). There may be an alpha-adrenergic (norepinephrine-mediated) vascular tone contribution (Lehrer & Gevirtz, 2021). PNS activity may contribute to VLF power since parasympathetic blockade almost completely abolishes it (Taylor et al., 1998).
Dr. Lehrer explains the VLF band © Association for Applied Psychophysiology and Biofeedback.
VLF Correlates
While low values on all 24-hour clinical HRV measurements predict a greater risk of adverse outcomes, VLF power is more strongly associated with all-cause mortality than LF or HF power (Hadase et al., 2004; Schmidt et al., 2005; Tsuji et al., 1994, 1996). The VLF rhythm may be fundamental to health (Shaffer, McCraty, & Zerr, 2014).
Low 24-hour VLF power is associated with arrhythmic death (Bigger et al., 1992) and PTSD (Shah et al., 2013). In several studies, low VLF power has been associated with high inflammation (Carney et al., 2007; Lampert et al., 2008).
Health is associated with greater 24-hour ULF, VLF, LF, HF, and total power, especially VLF power.
VLF Significance for HRV Biofeedback
Short-term VLF elevations may signal vagal withdrawal (parasympathetic suppression) due to chronic worry. During HRV biofeedback training, increased VLF may signal excessive effort (Gevirtz, 2017). When this happens, watch for increased skin conductance and decreased end-tidal CO2 and skin temperature.
Increased short-term VLF power is a red flag for worry or excessive effort.
Low-Frequency Band
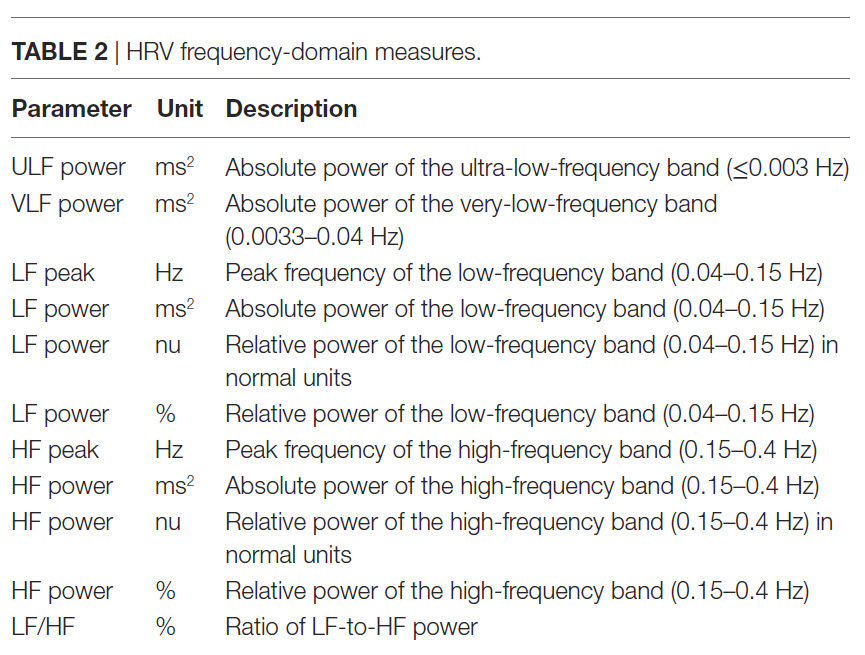
The low-frequency (LF) band (0.04-0.15 Hz) is comprised of rhythms with periods between 7 and 25 seconds, is affected by breathing from ~3-9 breaths per minute (bpm), and requires a recording period of at least 2 minutes (Task Force, 1996). The baroreflex system’s resonance falls within the LF band. This region was previously called the baroreceptor range because it reflects baroreceptor activity during resting conditions (McCraty & Shaffer, 2015).
LF Sources
While there is disagreement regarding this band's activity sources, a sympathetic role during resting measurements appears unlikely (Hayano & Yuda, 2019). The PNS and blood pressure regulation may produce LF power via baroreceptors (Akselrod et al., 1981; Berntson, Quigley, & Lozano, 2007; Lehrer, 2007; Task Force, 1996) or by baroreflex activity alone (Goldstein et al., 2011). Evgeny Vaschillo studied a possible SNS component near 0.05 Hz (Lehrer & Gevirtz, 2021). Breathing at rates below 8.5 breaths per minute, sighing, and taking deep breaths may contribute to LF activity via the vagus (Shaffer, McCraty, & Zerr, 2014).
Dr. Lehrer explains the LF band © Association for Applied Psychophysiology and Biofeedback.
LF Correlates
In resting conditions, the LF band reflects baroreflex activity and not cardiac sympathetic innervation (Shaffer, McCraty, & Zerr, 2014).
LF Significance for HRV Biofeedback
Use LF band power to assess training success when your client breathes or contracts their musculature from 4.5-7.5 bpm/cpm (Shaffer & Ginsberg, 2017). Watch Dr. Inna Z. Khazan's demonstration of an engaging LF training screen from the Biofeedback Federation of Europe's (BFE) Mindfulness Suite. The kittens frolic as LF power increases and VLF and HF power decrease during low-and-slow breathing.
Expect elevated LF power during resonance frequency (RF) breathing, muscle contraction, or both. See the high-amplitude peak frequency of 0.1 Hz in the LF band (left) and the elevated RSA (Maximum - Minimum Heart Rate) of 36 (top center) during combined slow-paced breathing and muscle contraction.

Caution: high LF at typical breathing rates (e.g., 12-14 bpm) signals that the vagal brake is malfunctioning (Khazan, 2020).
A single high amplitude peak near 0.1 Hz indicates high coherence within the Institute of HeartMath model.
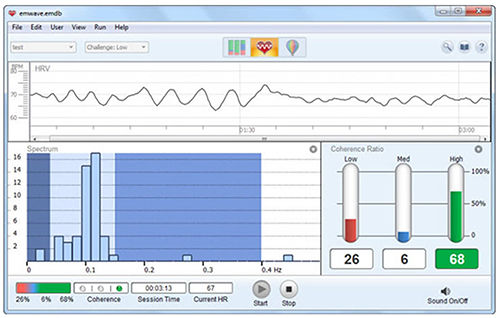
Caption: The Institute of HeartMath display shows instantaneous HR at the top. The bottom left features an HRV spectral display. Note that there are two peaks around 0.1 Hz instead of one. The bottom right shows coherence ratios. Note that the individual has only achieved 68% high coherence at the low challenge level.
Coherence is a proprietary Institute of HeartMath term that means a "narrow, high-amplitude, easily visualized peak" from 0.09-0.14 Hz (Ginsberg, Berry, & Power, 2010, p. 54).
High-Frequency Band
The high-frequency (HF) or respiratory band (0.15-0.40 Hz) is influenced by breathing from 9-24 bpm (Malik, 1996) and requires a recording period of at least 1 minute. For infants and children, who breathe faster than adults, the resting range can be adjusted to 0.24-1.04 Hz (Quintana et al., 2016).
HF Sources
The HF band reflects parasympathetic activity and is called the respiratory band because it corresponds to the HR variations related to the respiratory cycle. These phasic HR changes are known as respiratory sinus arrhythmia (RSA) and may not be a pure index of cardiac vagal control (Grossman & Taylor, 2007).
Recall that heart rate (HR) accelerates during inspiration and slows during expiration. During inhalation, the cardiovascular center inhibits vagal outflow, speeding the HR. Conversely, during exhalation, it restores vagal tone, slowing the HR via the release of acetylcholine (Eckberg & Eckberg, 1982).
Total vagal blockage virtually eliminates HF oscillations and reduces power in the LF range (Shaffer, McCraty, & Zerr, 2014).
Dr. Lehrer explains the HF band © Association for Applied Psychophysiology and Biofeedback.
HF Correlates
HF power is highly correlated with the pNN50 and RMSSD time-domain measures (Kleiger et al., 2005). HF band power may increase at night and decrease during the day (McCraty & Shaffer, 2015). Lower HF power is correlated with stress, panic, anxiety, or worry. Vagal tone modulation helps maintain the dynamic autonomic regulation important for cardiovascular health. Deficient vagal inhibition is associated with increased morbidity (Thayer et al., 2010).
HF Significance for HRV Biofeedback
Use HF band power and time-domain metrics like RMSSD to assess HRV biofeedback training success during resting baselines (Shaffer & Ginsberg, 2017).
We train clients to increase LF power in the clinic to enhance vagal tone and HF power when they breathe at typical rates in everyday life (Gevirtz, 2020).
The graphic below shows HF power in blue during a pre-training baseline, HRVB training, and a post-training baseline. Note the greater HF power concentration post-training compared with pre-training during which the client breathed at typical rates. Dr. Inna Z. Khazan generously provided the spectral plots.

Training elite soldiers to master higher HRV under stress conditions is correlated with improved cognitive performance under such conditions. Graphic © PRESSLAB/Shutterstock.com.

The Controversial LF/HF Ratio
Power is the signal energy contained within a given frequency band. The ratio of LF to HF power is called the LF/HF ratio. This ratio was based initially on 24-hour recordings, during which both PNS and SNS activity contribute to LF power. PNS activity generates HF power. The intent was to estimate the ratio between SNS and PNS activity.
Calculating an LF/HF ratio from brief or resting recordings is controversial because short-term measurements correlate poorly with 24-hour values. Moreover, the SNS contribution to LF activity varies profoundly with testing conditions (Lehrer, 2012). For example, when LF is calculated during resting conditions, the primary contributors are PNS activity and baroreflex activity—not SNS activity. Therefore, a 5-minute resting baseline cannot estimate autonomic balance (McCraty, 2013).
. . . this view has been highly criticized (Eckberg, 1997; Billman, 2013). Among the most critical aspects is the loose relationship between LF power and sympathetic nerve activation, and the nonlinear and non-reciprocal relationship between sympathetic and parasympathetic nerve activity (Billman, 2013). Laborde et al. (2017).
Vagal Tone
HF Power and RSA Do Not Represent Vagal Tone
Vagal tone refers to the vagus nerves' firing rate. In healthy individuals, RSA can be increased by slow, deep breathing. Respiration rate changes can produce large-scale shifts in RSA magnitude without affecting vagal tone, which would involve mean HR change across conditions (e.g., rest to exercise) (Grossman, 2017b).
Grossman (2017a) proposed an experiment. If you slow your breathing to 6 bpm, you should observe increased HR fluctuations compared with 15 bpm. During this time, mean HR should not appreciably change because the vagal tone did not decrease.
Although HF power indexes vagal modulation of HR, it does NOT represent vagal tone. If shifts in HF power mirrored shifts in vagal tone, they should produce corresponding changes in average HR. But, breathing at different rates within the 9-24-bpm range, which changes HF power, does not change mean HR.
RSA and vagal tone are dissociated during large-scale changes in SNS activity, chemical blockade of the SA node, and when intense vagal efferent traffic dramatically slows HR during inhalation and exhalation (Grossman & Taylor, 2007).
Shifts in respiration rate and volume can markedly change HRV indices (HF power, peak-to-trough differences, pNN50, RMSSD) without affecting vagal tone.
Ln HF Power Can Estimate Vagal Tone Under Controlled Conditions
The natural logarithm (Ln) is the logarithm to the base e of a numeric value. Under controlled conditions while breathing at normal rates, we can use LnHF power to estimate vagal tone (Gevirtz, 2017).
Baroreflex sensitivity is strongly associated with power in the high-frequency band.
In the Kubios table below, HF power of 910.67 corresponds to LnHF of 6.81.

Age and Circadian Effects on HRV
Age and time of day strongly influence HRV measurements.
Age
In a cross-sectional study of 8,203,261 participants using 24-hour Fitbit photoplethysmographic recordings, all HRV time- and frequency-domain metrics declined between ages 20 and 60. These included low-and high-frequency power (Natarajan et al., 2020).
Almedia-Santos et al. (2016) obtained 24-hour ECG recordings of 1743 subjects 40-100 years of age. They found a linear decline in the SDNN, SDANN, and SDNN index. However, they found a U-shaped pattern for the RMSSD and pNN50 with aging, decreasing from 40-60 and then increasing after age 70. The age groups were 1 (40–49 years), 2 (50–59 years), 3 (60–69 years), 4 (70–79 years), and 5 ( ≥ 80 years).
Time of Day
All HRV metrics reached their maximum values between 5 and 8 am and minimum values between 7 and 10 pm.
Summary
Heart rate variability (HRV) frequency-domain metrics quantify the absolute or relative power within four frequency bands. HRV frequency-domain measurements reveal the sources of physiological changes. Use LF power to assess training success [during a session] when clients perform slow-paced breathing or muscle contraction. Use the Ln HF power to assess resting HRV during baselines when clients breathe at typical rates. Consider age and time of day when interpreting your clients' HRV frequency-domain values.
Glossary
absolute power: the magnitude of HRV within a frequency band measured in milliseconds squared divided by cycles per second (ms2/Hz).
coherence: self-coherence; signal power in the 0.09-0.14 region of the LF band.
heart rate: the number of heartbeats per minute, also called stroke rate.
heart rate variability (HRV): the beat-to-beat changes in heart rate, including changes in the RR intervals between consecutive heartbeats.
High-frequency (HF) band: an HRV frequency range from 0.15-0.40 Hz representing the vagus nerve's inhibition and activation by breathing (respiratory sinus arrhythmia).
interbeat interval (IBI): the time interval between the peaks of successive R-spikes (initial upward deflections in the QRS complex). This is also called the NN (normal-to-normal) interval.
low-frequency (LF) band: an HRV frequency range of 0.04-0.15 Hz that may represent the influence of PNS and baroreflex activity (when breathing at the RF).
natural logarithm (Ln): the logarithm to the base e of a numeric value.
normal units (nu): the division of the absolute power for a specific frequency band by the summed absolute power of the low frequency (LF) and high frequency (HF) bands.
power: the signal energy found within a frequency band.
relative power: the percentage of total HRV.
spectral analysis: the division of heart rate variability into component rhythms that operate within different frequency bands.
total power: the sum of power (ms2) in the ULF, VLF, LF, and HF bands for 24-hour recording and the VLF, LF, and HF bands for brief recording.
ultra-low-frequency (ULF) band: an HRV frequency range below 0.003 Hz. Very slow biological sources include circadian rhythms, core body temperature, metabolism, the renin-angiotensin system, and possible PNS and SNS contributions.
vagal withdrawal: parasympathetic nervous system suppression due to chronic sympathetic activation and worry, and acutely to excessive effort.
very-low-frequency (VLF): an HRV frequency range of 0.003-0.04 Hz that may represent temperature regulation, plasma renin fluctuations, endothelial, physical activity influences, and possible intrinsic cardiac, PNS, and SNS contributions.
References
Andreassi, J. L. (2000). Psychophysiology: Human behavior and physiological response. Lawrence Erlbaum and Associates, Inc.
Armour, J. A. (2003). Neurocardiology: Anatomical and functional principles. Institute of HeartMath.
Berntson, G. G., Quigley, K. S., & Lozano, D. (2007). Cardiovascular psychophysiology. In J. T. Cacioppo, L. G. Tassinary, & G. G. Berntson (Eds.). Handbook of psychophysiology (3rd ed.). Cambridge University Press.
Claydon, V. E., & Krassioukov, A. V. (2008). Clinical correlates of frequency analyses of cardiovascular control after spinal cord injury. American Journal of Physiology—Heart and Circulatory Physiology, 294(2), H668-H678. https://doi.org/10.1152/ajpheart.00869.2007
Combatalade, D. (2010). Basics of heart rate variability applied to psychophysiology. Thought Technology Ltd.
Gevirtz, R. N. (2017). Cardio-respiratory psychophysiology: Gateway to mind-body medicine.
Gevirtz, R. N. (2020). The myths and misconceptions of heart rate variability. Association for Applied Psychophysiology and Biofeedback Virtual Conference.
Goldstein, D. S., Bentho, O., Park, M. Y., & Sharabi, Y. (2011). Low frequency power of heart rate variability is not a measure of cardiac sympathetic tone but may be a measure of modulation of cardiac autonomic outflows by baroreflexes. Exp Physiol, 96(12), 1255-1261. https://doi.org/10.1113/expphysiol.2010.056259
Grossman, P. (2017a and 2017b). Comments on Heart rate variability and cardiac vagal tone in psychophysiological research. Frontiers in Psychology.
Grossman, P., & Taylor, E. W. (2007). Toward understanding respiratory sinus arrhythmia: Relations to cardiac vagal tone, evolution and biobehavioral functions. Biological Psychology, 74, 263-285. https://doi.org/10.1016/j.biopsycho.2005.11.014
Khazan, I. (2020). The myths and misconceptions of heart rate variability. Association for Applied Psychophysiology and Biofeedback Virtual Conference.
Lehrer, P. M. (2007). Biofeedback training to increase heart rate variability. In P. M. Lehrer, R. M. Woolfolk, & W. E. Sime (Eds.). Principles and practice of stress management (3rd ed.). The Guilford Press.
Lehrer, P. M. (2012). Personal communication about the sources of frequency domain measurements.
Lehrer, P. M., & Gevirtz, R. (2021). BCIA HRV Biofeedback didactic workshop. Association for Applied Psychophysiology and Biofeedback.
Lehrer, P. M., Vaschillo, E., & Vaschillo, B. (2000). Resonant frequency biofeedback training to increase cardiac variability: Rationale and manual for training. Applied Psychophysiology and Biofeedback, 25(3), 177-191. https://doi.org/10.1023/a:1009554825745
McCraty, R. (2013). Personal communication regarding the LF/HF ratio.
Moss, D. (2004). Heart rate variability (HRV) biofeedback. Psychophysiology Today, 1, 4-11. Natarajan, A., Pantelopoulos, A., Emir-Farinas, H., & Natarajan, P. (2020). Heart rate variability with photoplethysmography in 8 million individuals: a cross-sectional study. The Lancet. Digital Health, 2(12), e650–e657. https://doi.org/10.1016/S2589-7500(20)30246-6
Nunan, D., Sandercock, G. R. H., & Brodie, D. A. (2010). A quantitative systematic review of normal values for short-term heart rate variability in healthy adults. Pacing and Clinical Electrophysiology, 33(11), 1407-1417. https://doi.org/10.1111/j.1540-8159.2010.02841.x Tarvainen, M. P., & Niskanen, J.-P. (2022). Kubios HRV version 4.0 user's guide. University of Finland.
Task Force of the European Society of Cardiology and the North American Society of Pacing and Electrophysiology (1996). Heart rate variability: Standards of measurement, physiological interpretation, and clinical use. Circulation, 93, 1043-1065. PMID: 8598068
Theorell, T., Liljeholm-Johansson, Y., Björk, H., & Ericson, M. (2007). Saliva testosterone and heart rate variability in the professional symphony orchestra after “public faintings” of an orchestra member. Psychoneuroendocrinology, 32, 660–668. https://doi.org/10.1016/j.psyneuen.2007.04.006
Feedback

We value your feedback because we produce these posts for you. Please complete our brief survey to help us improve this service.


Fred,
Thanks for the clarification. I will most definitely read: Vaschillo, E., Lehrer, P., Rishe, N., & Konstantinov, M. (2002). Heart rate variability biofeedback as a method for assessing baroreflex function: A preliminary study of resonance in the cardiovascular system. Applied Psychophysiology and Biofeedback, 27, 1-27.
I hope I can improve my understanding of the complex processes involved. I was a bit amused by your opening statement. I can second that. That's why I was a bit perplexed, and still am, probably because of an incomplete understanding. I have been assuming that increased HRV resulted in increased vagal tone. Porges never stated that, but he did (I better look it up!) state that vagal tone could be measured by HRV.…
OK, so Stephen Porges statement in his text on Polyvagal Theory that increased HRV is a direct measure of vagal tone is erroneous? The statement that vagal tone can be "indexed" by HRV or RSA is mysterious. What does "indexed" mean if not measured?
Grossman's suggested experiment has been repeated many times over in my biofeedback practice. It is very often accompanied by a decrease in HR. It's one of the most common measures associated with SPB at 6BPM. Doesn't this indicate an increase in the vagal brake, an increase in vagal tone?
What am I missing here? I am ready to consider an alternative explanation for the decrease in HR often associated with SPB. Help me out here.
I…