
John S. Anderson on Frequency vs. Amplitude
- qeegjohn
- Apr 10
- 14 min read
Updated: 3 days ago
The EEG signal and how it is measured are covered in depth in Neurofeedback Tutor. However, many practitioners struggle to understand these concepts simply for day-to-day use when working with clients. This is made even more confusing by the numerous terms used to describe the various components of this complex signal. I wrote this post to clear up confusion about these concepts and give you a basic format for thinking about the EEG signal.

Understanding EEG Feedback and Alpha Activity
Remember that the EEG on the scalp results from activity that has already occurred within the brain. Training scalp EEG rewards the brain for making internal changes that result in changes in that scalp EEG that can be recorded and fed back to the client during training. Raising your alpha amplitude doesn't necessarily make you more relaxed. Becoming more relaxed may increase alpha activity. That is, increased alpha may be a physiological correlate of relaxing, not a direct cause, where feedback about the alpha increase serves as a reinforcer of a multifaceted relaxation experience so that as relaxation increases, so does the alpha activity.
Fundamentals of EEG Frequency and Amplitude
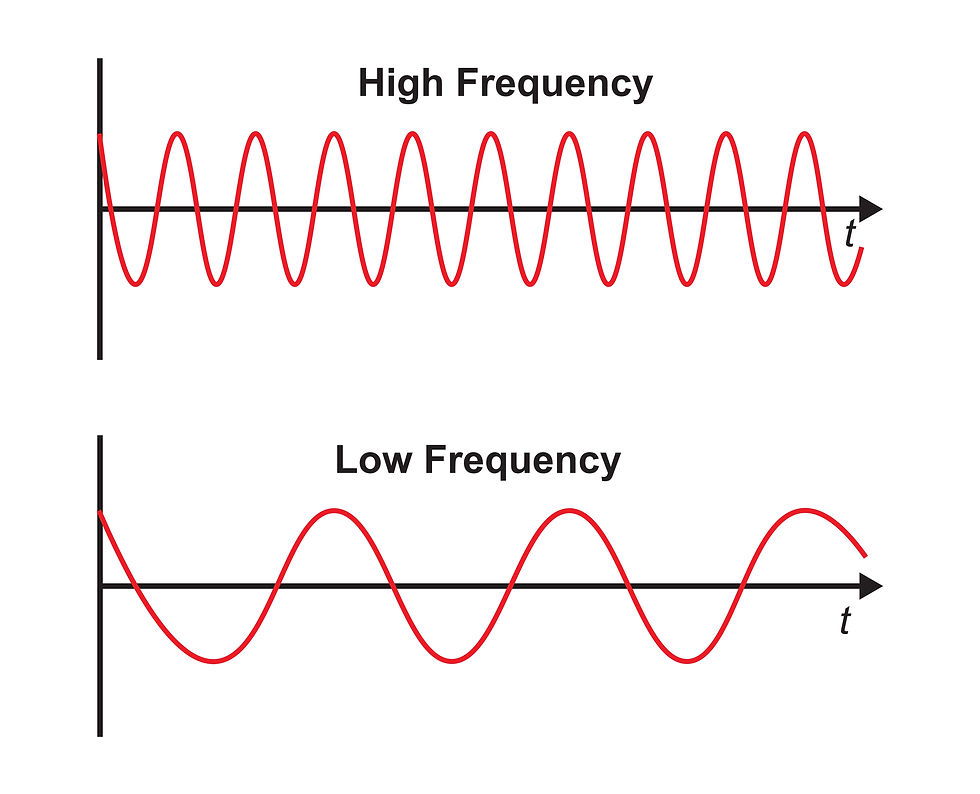
We talk about EEG mostly in terms of frequency and amplitude. The term frequency means how often the wave occurs within 1 second – the number of waves per second. This value is sometimes called cycles per second but is more commonly known as hertz or Hz. Frequency graphic © Bany's beautiful art/Shutterstock.com.
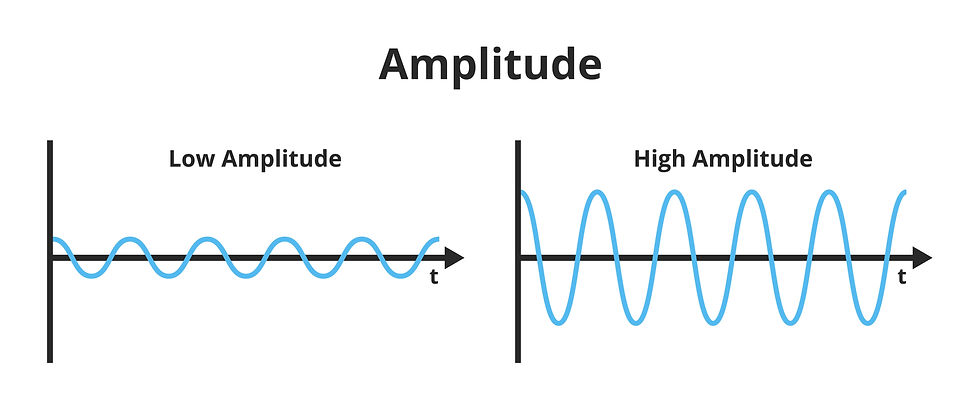
Amplitude is the signal voltage or power measured in microvolts or picowatts. Amplitude graphic © petrroudny43/Shutterstock.com.
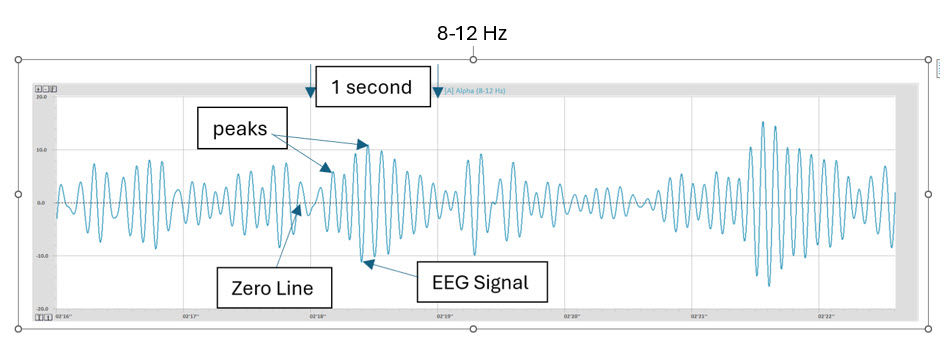
The image below shows an EEG signal "waving" at 10 Hz. Note that the scale on the left of the image shows a range from -20 to +20 microvolts (uV), with zero in the middle. The vertical lines in the graph below represent 1-second sections.
Zero-Crossing Method for Frequency Determination
If you count the number of times the wave crosses the zero line within the 1-second section marked with the arrows and divide by 2, you will have the frequency of the wave, which is 10 Hz. This is known as the zero-crossing method. To find the frequency, you can also count the number of peaks above the zero line within the same 1-second period.
Filtered vs. Raw EEG Signals
However, this is a filtered EEG signal, meaning only the EEG activity between 8 and 12 waves per second is displayed. This makes it easier to see and understand the 8-12 Hz alpha signal, but it doesn't show the true complexity of the EEG signal. Below is the raw EEG signal from the same recording at the same location. The scale is now -40 to +40 uV rather than the previous -20 to +20, so the whole signal will fit within the graph.
Challenges in Visualizing Raw EEG
You'll see that the nicely sinusoidal (sine wave-like) alpha signal is more difficult to appreciate clearly amid all the other EEG components or frequencies that occur simultaneously. This is one reason for various methods used to separate the different frequencies from each other so they can be viewed individually. Also, note that the EEG signal constantly varies from positive to negative values. Traditionally, negative is plotted up, but systems differ, and in this display, positive is up, and negative is down. It's always important to examine details like the scale used for the vertical y-axis and the horizontal x-axis.
Comparing EEG Representations: Raw Signal and FFT
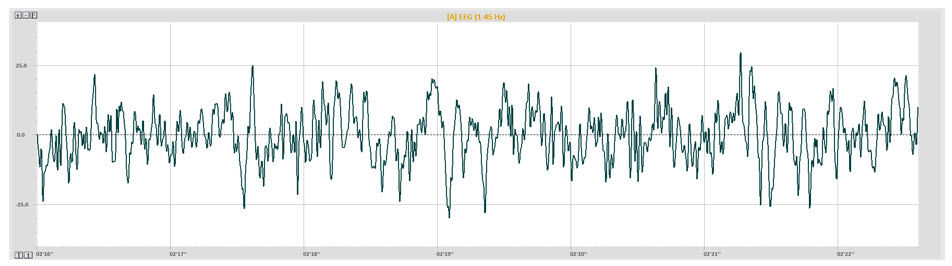
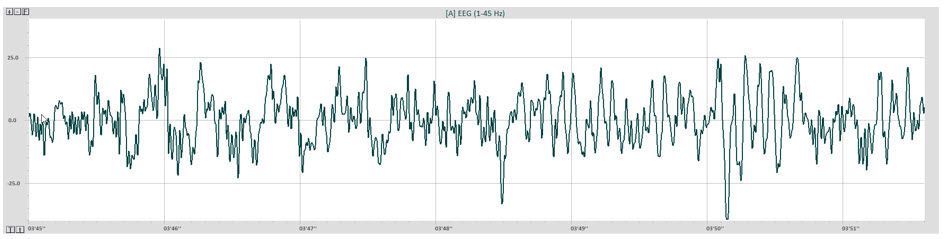
The following two views show the same EEG information. The first image shows raw (1-45 Hz) EEG as an undifferentiated line graph with voltage (amplitude) in the left side scale (y-axis) and time along the bottom (x-axis).
The second image shows a graphic display of the results of a Fast Fourier Transformation (FFT). This converts the raw EEG into a frequency and magnitude (amplitude over time). In this example, 2 seconds of data are represented, Magnitude is shown by the y-axis for each individual frequency along the x-axis. Collections of single frequencies that make up bands of delta (1-4 Hz), theta (4-8 Hz), alpha (8-12 Hz), SMR (12-15 Hz – also known as beta1), and low (15-22 Hz – beta 2), middle (22-36 Hz – beta 3) and high beta (36-45 Hz – also called beta 4 or gamma), are identified via individual colors. These frequency band designations may vary slightly among systems.
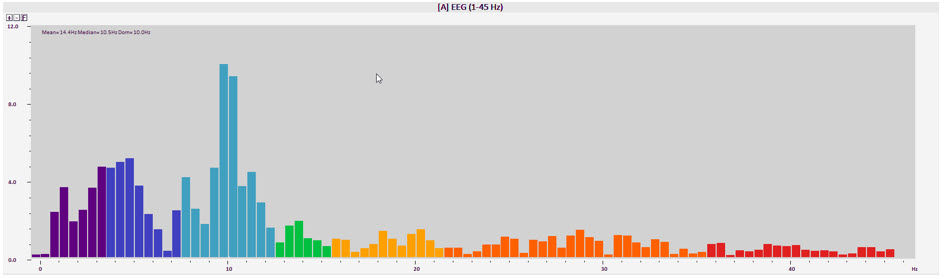
As you can see, the FFT display separates the frequency and amplitude information in such a way that makes it easier to see at a glance how much activity occurs in each EEG frequency band, the peak frequency (the highest voltage within a given band, such as 10 Hz in the alpha band above), and, in this display, the mean, median and dominant frequency are also displayed as text in the upper left corner.
EEG Artifacts: Eye Movement and Muscle Activity
However, this clarity comes at the expense of vital information. How much of the activity represented is the result of artifact, like eye movement and muscle activity (EMG)? Once the data is processed, it is impossible to know this information, and, in this example, there is a significant eye artifact, though not much EMG. This eye artifact elevates the low-frequency voltage because eye movement and blinking produce electrical discharges in delta and low theta frequencies. These are not coming from the brain as EEG but are simply within the same frequencies and are plotted into the EEG graph.
Time Resolution and Data Averaging in FFT Analysis
Additionally, the display shows the result of calculating 2 seconds of EEG data. It is a composite of those 2 seconds of information and therefore, loses the moment-by-moment information of the raw display. The minimum window of time required for an FFT calculation is 1 second. However, it can also utilize multiple minutes of data to represent average activity over a longer time. This latter ability is useful for creating normative databases and topographic maps.
To summarize, frequency means how frequently the wave occurs within 1 second, and amplitude means the amount of electrical activity within that frequency band during that period.
Categorical vs. Quantitative EEG Descriptors
As shown in the FFT graph, we can also see individual 0.5 Hz segments of the EEG or smaller, depending on software and hardware configurations. More commonly, we look at 1 Hz frequency 'bins' or segments. This can provide useful information, particularly for identifying interesting features such as mu rhythm, which are often isolated by location and frequency bin.
Inconsistencies in Frequency Band Labels
Terminology regarding frequency and amplitude can also be confusing. The EEG is often described using terms like fast, slow, high, low, voltage, power, relative power, percent power, amplitude, and more.
The Importance of Precision in EEG Reporting
For example, the beta frequencies between 24-36 Hz may be called high, fast, or beta 3. Frequencies between 25 and 45 Hz may be called gamma or beta 4. High beta may also have a high or low amplitude, so high, high beta, or low high beta. Alpha may be described as low, slow, high, or fast and may also be high amplitude or low amplitude, so high, high alpha, low high alpha, low, low alpha, high low alpha, and so on. Frequencies may also be further separated into smaller parts, such as alpha 1 and alpha 2, beta 1, 2, 3, 4, etc.
The Role of Frequency-Amplitude Relations in Protocol Design
When the practitioner is simply trying to read an assessment report to determine a training protocol for a client, the lack of precision when using categorical terminology (e.g., alpha) instead of a quantitative descriptor can be problematic.
Avoiding Ambiguity in EEG Language Use
A better approach is to identify the EEG by the frequency being discussed, such as 8-10 Hz (instead of alpha 1), 24-36 Hz (instead of beta 3), and 36-44 Hz (instead of beta 4 or gamma). The sharp-eyed reader may notice that I have occasionally used different frequency designations for the various labeled frequencies, particularly in the beta band, because that reflects the inconsistencies in labeling that have existed in electroencephalography from the beginning. All the more reason to say 13-21 Hz or 4-8 Hz or 2-6 Hz so everyone knows what you mean.
Understanding Power and Power Spectrum in EEG
Also, using the terms high, fast, low, slow, more, less, greater, decreased, etc., constitutes potentially confusing descriptions. Occasionally, a research paper will describe "an increase in activity in the frontal EEG." Does this mean an increase in 8-12 Hz, 15-18 Hz, and 4-8 Hz? If it describes a general increase in voltage, the lack of precise amplitude and frequency information reduces the useful information in the statement to almost zero.
Magnitude vs. Power Spectrum: Visual Differences
Precise language is important. A description could state, "An increase in 4-8 Hz amplitude from 4 uV to 6 uV was noted in the prefrontal cortex during an active memory recall task." Considering the association that abnormally high amplitude in that frequency band (conventionally "theta") has with reduced cognitive performance when seen in the pre-frontal cortex, this useful information could suggest that the person shows a decrease in engagement during such a task or that the prefrontal cortex is exerting less-than-normal cognitive control during this specific task, or some other conclusion.
However, combined with behavioral information such as the degree of success in the task and information from other testing, these EEG data can help identify the specific location of activity that correlates with a behavioral concern and can lead to a training protocol. If an increase in amplitude in the 4-8 Hz frequency band over the prefrontal cortex is associated with lower scores on the memory task, then training to decrease prefrontal 4-8 Hz over the prefrontal cortex could improve memory.
Effects of Squaring on EEG Differentiation
Specific language can clarify what is being presented instead of slow, fast, high, low, etc. Of course, such shorthand has evolved to make our lives easier. Someone might say, "That alpha is really high," but does this mean high amplitude, high-frequency alpha, or high peak alpha frequency? Language usage is a dynamic function. The best we can do when dealing with ambiguity is to ask for clarification if possible. However, it is important to use precise terminology when writing for publication and clinical reports.
Relative Power: Concept and Calculation
The terms power and relative power, percent power, and normalized EEG require explanation.
Power means amplitude squared. For example, 4 uV2 equals 16 picowatts (pW). Though it is a different value, it still represents the amount of electrical activity in the EEG. Some reasons for squaring the EEG include converting the negative component of the waveform into positive values. This allows for complex calculations. Because the EEG constantly fluctuates between positive and negative values above and below the zero line on an EEG graph, an average calculation over time will result in numbers around zero. Once amplitude is squared, it becomes a positive number so that averages, maximum and minimum, standard deviations, and other calculations can be made.
Historical Rationale for Normalized EEG Use
Another reason for squaring the EEG amplitude is to create greater differentiation between frequency bands. The image below shows 2 FFT displays. The top image shows the magnitude spectrum, which shows amplitude over time, corrected for sign, so that all data are presented as positive values. The lower image shows the power spectrum, displaying amplitude squared values, again in all positive values. Note the y-scale values are significantly different, with the top graph showing 0-12 uV and the bottom graph showing 0-96 pW.
Limitations of Comparative Power Measures
Note also that the various frequency bands show different comparative values. This is the effect of squaring a value. For example, 4 x 4 = 16, while 2 x 2 = 4, so the difference between the two values appears greater, 16 compared to 4 rather than 4 compared to 2. So, visually, the graph makes it easier to see which frequency is greater. This can be useful, particularly when calculating ratios. A theta/beta (4-8 Hz/13-21 Hz) ratio of 4/2 is less distinctive than 16/4.
Topographic Mapping of EEG Power
Power values are also used when calculating normative values in a database to show z-scores or deviations from mean values in standard deviations (SD).

The other power value often used in EEG is called by various names, including relative power, percent power, and normalized EEG. These terms all refer to the same measurement. We will use the common term relative power here.
Relative power refers to a calculation that converts the actual power, known as absolute power values, into percentages representing the power of each EEG frequency band compared to the power of the entire EEG band. The results are presented as percentages. See the example below:
If the entire EEG band (1-45 Hz in this example) has a power value of 100 and 8-12 Hz has a power value of 25, then the 8-12 Hz percentage is 25% of the total EEG power.
This method was used in the early days of EEG analysis because the amplifiers at the time gave widely varying voltage values for the EEG, even when recording the same individual. Hence, the term 'normalized EEG' is used because, following this transformation into percentages, results from any EEG recording could, in theory, be equivalently compared to any other.
This measure continues to be used extensively, even in recently published research studies. However, there are a few problems with this method. The first issue occurs when there is a very high amplitude frequency band in the EEG. This band then takes up a disproportionately larger percentage of the EEG pie, leaving the other frequencies representing lower-than-expected percentages that are misleading. This is especially problematic when comparing relative power values with topographic z-score maps from a normative database.
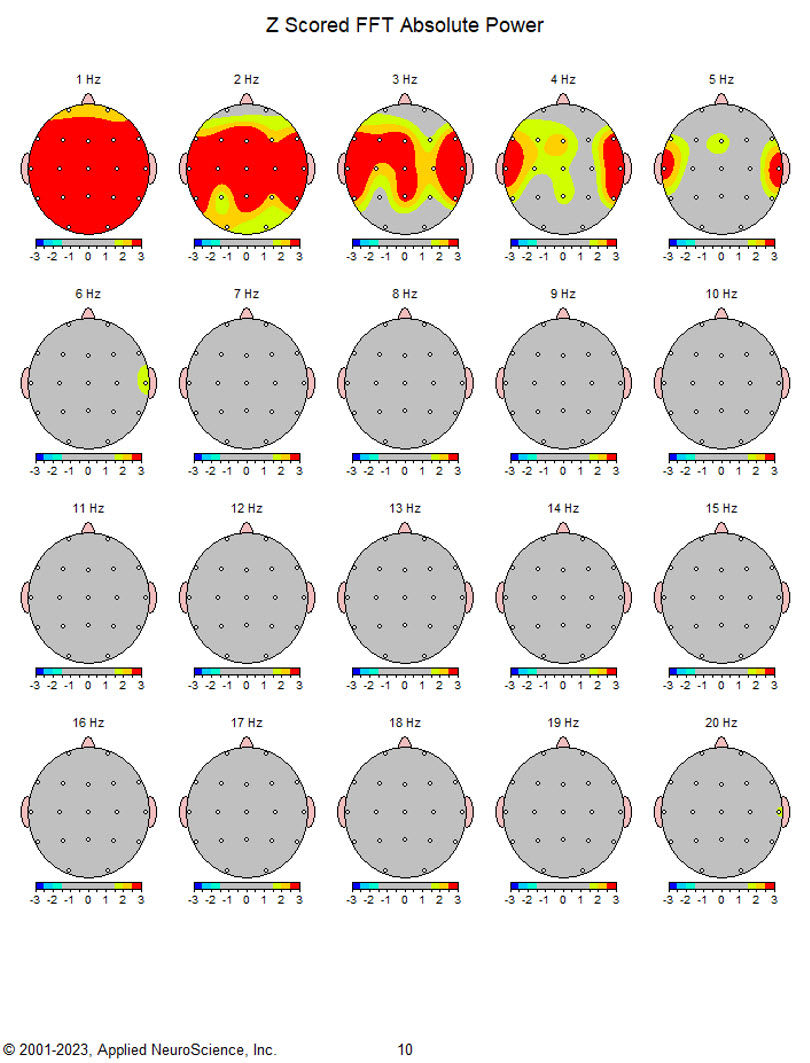
The example below shows the absolute power topographic maps as colored representations of the power of each 1 Hz bin. The color scale below each bin represents that specific bin's minimum to maximum values, with the highest values in red and the lowest in blue. These do not represent z-scores or standard deviations but simply absolute power.

Note that the amounts at 1 and 2 Hz are significantly higher than any other frequency bin, 18 and 19, respectively.
The following graphic shows the relative power maps with similar individual scales for each map, but showing percentages rather than absolute power.
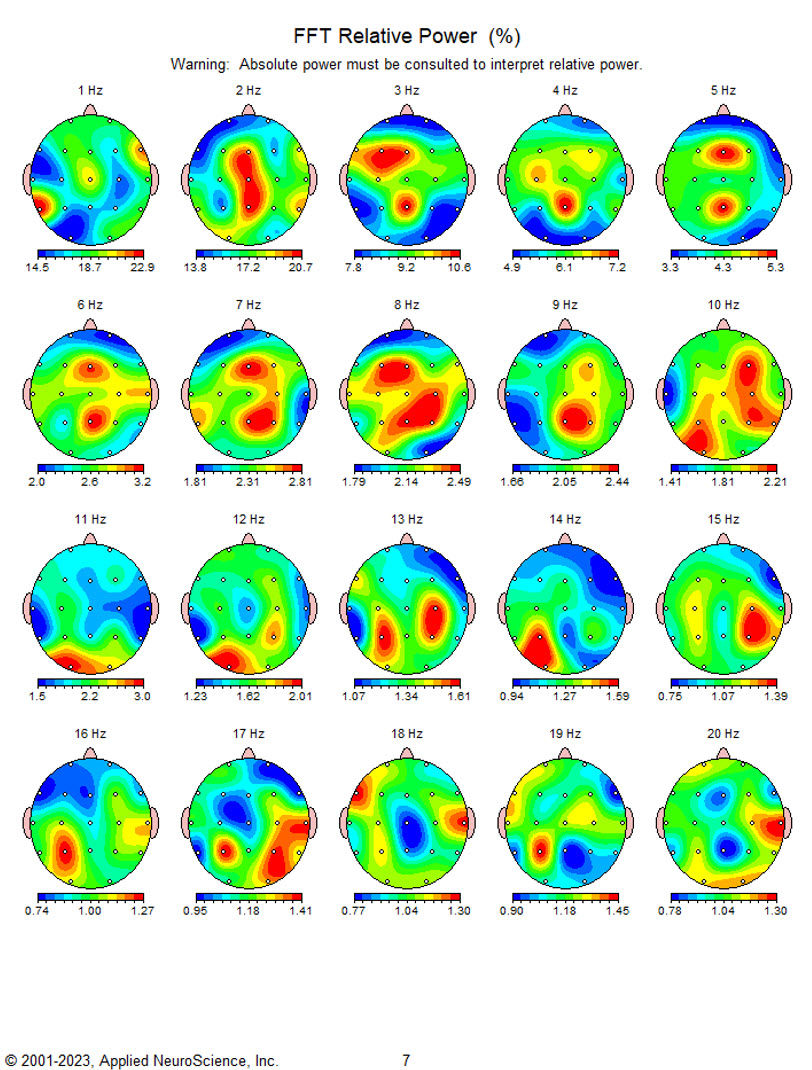
1 and 2 Hz show percentages of 22.9% and 20.7%, respectively. Significantly greater than any other frequency and together taking up 43.6% of the frequency "pie."
The next maps show absolute power z-score values. This time the scale is constant for all bins, showing -3 SD (blue) to +3 SD (red), indicating substantial deviations up to 3 SD from 1-5 Hz, with varying distributions across the scalp. Note that there are no blue areas showing deficient activity in any frequency bin.
The next map shows the relative power z-scores indicating most of the deviation, up to 3 SD, to be focused in the 1-Hz map, while maps from 6-16 Hz show varying degrees and distributions of negative values up to -3 SD.
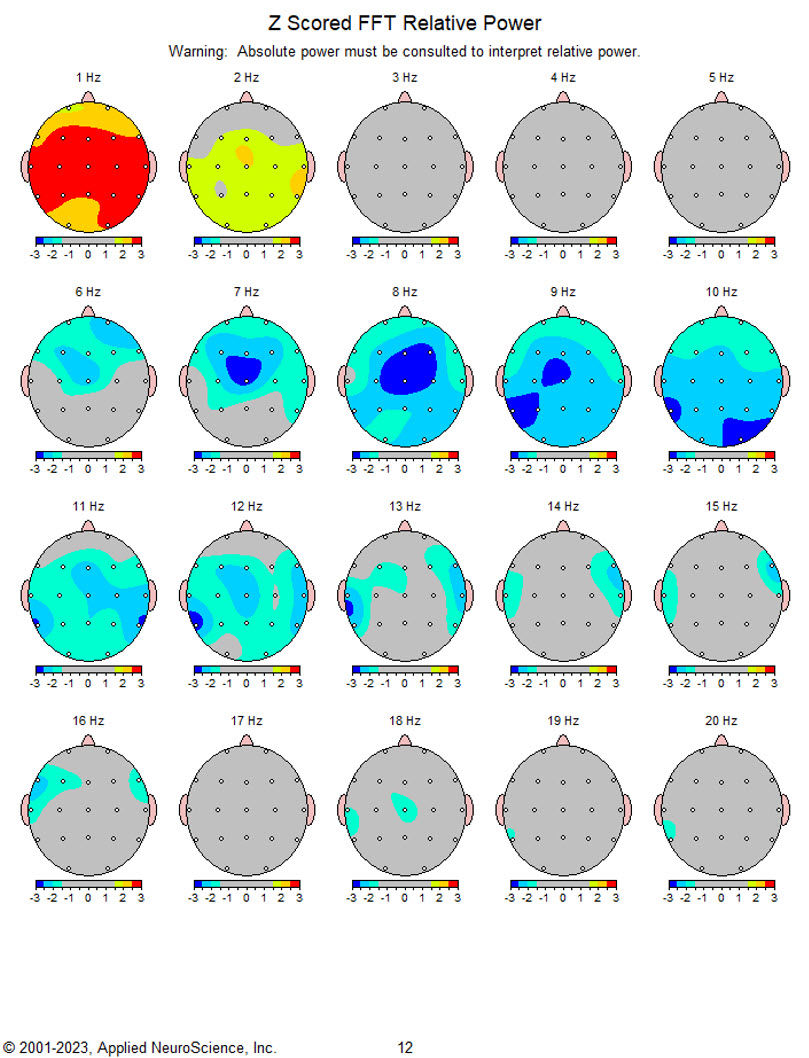
At a glance, without any other information, a practitioner might believe this client has too little 6-16 Hz activity in various locations and may set about training to increase these values. However, is this really true? In an absolute sense, there are no deficits, only in relation to the excessive values at 1 and 2 Hz. The other values may become more typical if that excess activity were reduced. This can be even more problematic when the excesses are in the higher beta frequencies such as 22-36 Hz. In this case, the lower frequencies in the 1-6 Hz range may appear deficient, and the practitioner may decide to train to increase 1-6 Hz. This can cause serious negative effects and is generally not recommended.
Conclusion
All of the previous information leads us to be careful with our assumptions, precise with our language, and cautious in our approaches to our client’s training. One of the most important things to remember in the analysis of the EEG, whether visually or quantitatively, is that it is a process that becomes more accurate as we develop our skills and refine our understanding of this elegant and information-rich measure.
Glossary
absolute power: the squared amplitude of EEG signals in a frequency band, expressed in physical units (e.g., uV²), representing the total electrical energy within that band over a specified time frame.
amplitude: the height of the EEG wave from the baseline, representing the magnitude of electrical activity in microvolts (uV).
artifact: non-cerebral electrical signals that contaminate EEG recordings, such as those caused by eye movements or muscle contractions.
beta: a general EEG frequency range typically subdivided into beta 1 (12–15 Hz), beta 2 (15–22 Hz), beta 3 (22–36 Hz), and beta 4 (36–45 Hz); involved in active thinking and focus.
cycles per second: an older term equivalent to hertz (Hz), indicating how many times a wave oscillates in one second.
delta: the lowest EEG frequency band, typically 1–4 Hz, associated with deep sleep or pathological conditions when seen during wakefulness.
dominant frequency: the frequency within a band showing the greatest amplitude or power.
EEG (electroencephalogram): a recording of electrical activity generated by brain neurons, measured on the scalp using electrodes.
EMG (electromyography): a technique measuring muscle activity, which can appear as artifact in EEG recordings.
filtered signal: an EEG signal that displays only a selected frequency range (e.g., 8–12 Hz), excluding other frequencies to simplify analysis.
frequency: the number of oscillations or cycles of a wave occurring in one second, measured in hertz (Hz).
FFT (Fast Fourier Transform): a mathematical algorithm that decomposes EEG signals into their constituent frequencies and their corresponding amplitudes or power values.
gamma: a high-frequency EEG band, typically above 36 Hz, often associated with cognitive and sensory integration.
hertz (Hz): the SI unit of frequency, representing one cycle per second.
high beta: generally refers to beta activity in the 36–45 Hz range, though definitions vary; associated with hyperarousal and stress.
low beta: typically the 12–15 Hz band (also known as SMR), associated with sensorimotor rhythm and relaxed attention.
magnitude: in EEG, the amplitude of a frequency component, often displayed in FFT plots.
microvolt (uV): a unit of electric potential equal to one-millionth of a volt; commonly used to express EEG amplitude.
mu rhythm: an 8–12 Hz EEG rhythm localized over the sensorimotor cortex, suppressed during motor activity or observation.
peak frequency: the frequency within a band where the maximum amplitude or power occurs.
picowatt (pW): a unit of power equal to one trillionth of a watt (1 pW = 10⁻¹² watts). In EEG analysis, power values derived from squared amplitudes (e.g., microvolt²) can be converted into picowatts to express the amount of electrical energy in the brain's frequency bands in standardized units.
power: the square of EEG amplitude, used to quantify the energy in a frequency band; expressed in uV² or converted units (e.g., picowatts).
power spectrum: a graphical representation of EEG power values across frequencies, typically displayed as amplitude squared (power) over frequency.
prefrontal cortex: the anterior part of the frontal lobes of the brain, involved in executive functions and cognitive control.
raw EEG: unfiltered EEG data showing the full range of brainwave activity (typically 1–45 Hz), including all frequency components and potential artifacts.
relative power: the percentage of power in a specific frequency band relative to the total power across all bands (e.g., 8–12 Hz power as a percentage of 1–45 Hz total power).
sensorimotor rhythm (SMR): a sub-band of beta (12–15 Hz), associated with motor inhibition and relaxed alertness.
standard deviation (SD): a statistical measure of dispersion that quantifies the variation or spread in a set of values. In EEG, SD is used to express how much an individual’s EEG measurement deviates from the mean of a normative database, often as z-scores. One SD represents the range within which approximately 68% of the data values fall in a normal distribution.
theta: an EEG frequency band typically ranging from 4–8 Hz, associated with drowsiness, inattention, and some memory processes.
theta/beta ratio: a quantitative EEG metric calculated by dividing the amplitude or power of the theta band (typically 4–8 Hz) by that of the beta band (often 13–21 Hz). It is commonly used in neurofeedback and clinical research as a biomarker, especially in attention-related disorders such as ADHD.
topographic map: a spatial representation of EEG activity across the scalp, showing distributions of amplitude or power in various frequency bands.
uV² (microvolt squared): unit of EEG power, representing the square of amplitude in microvolts.
zero-crossing method: a technique for estimating frequency by counting how many times a waveform crosses the zero-voltage line in one second and dividing by two.
z-score: a standardized score indicating how many standard deviations an observed EEG value deviates from the normative mean; used in qEEG analysis.
About the Author
John S. Anderson, MA, LADC, BCB, BCN, QEEGD, is a veteran neurofeedback practitioner and educator with over five decades of experience in biofeedback and neurofeedback, beginning his work in 1974. He holds a master's degree in psychology and is certified by the Biofeedback Certification International Alliance (BCIA) and the International QEEG Certification Board. As the founder of the Minnesota Neuro-Training Institute, Anderson provides clinical services, mentorship, and professional training in neurotherapy. His clientele includes individuals with ADHD, learning disorders, chronic pain, and addiction. He is also a recognized instructor, offering BCIA-approved courses and QEEG certification programs, and contributes to educational initiatives such as Biosource Software's "Seminars Without Borders." Anderson integrates holistic healing practices with contemporary neurophysiological research to develop effective neurofeedback protocols.

Support Our Friends


Comments